Showing posts with label dividend. Show all posts

Sunday, May 10, 2020

Portfolio Update - April 2020

Portfolio Update - April 2020

Today I am going to show my portfolio at the end of April 2020. My investment strategy is I monthly invest 10% of my salary and I invest 80% of that money in on ly dividend growth stocks, 10% non-dividend paying stocks, and 10% in cryptos. This month I did not invest to any stocks. I am holding cash right now to buy at a discount. In this month I have sold 5 JPM stocks @$91. The table below shows my current portfolio distribution

The following pie chart shows the same distribution and currently AAPL is my maximum holding followed by MMM, JNJ, and ABBV. In future I will slowly add JNJ, HD, and MSFT. 

The sector distribution of my portfolio is shown in the following pie chart. The sectors are based on Yahoo Finance. Currently, my highest position is in the health sector followed by technology and consumer cyclical. 


The following tree map shows the sector distributions and the stocks under each stocks. 


I always update my transaction in the tipranks website and the figure below compares my portfolio performance against the S&P 500. In most of the cases my portfolio beat the market.


The following table shows my growth of my portfolio since 2017 and the comparison with the Vanguard 500 Index. I plotted this figure from portfoliovisualizer. I am slightly beating the index. 

from portfoliovisualizer.

My performance as a portfolio manager is also not bad. At the end of April I was ranked 1658 out of 27341 investors in tipranks which is at the top 6%. My portfolio has gained 47% since I started to invest since August 2017. My sharpe ratio is 1.4 while the average ratio among the tipranks investors is 0.3. 


My 12 month returns (TTM) is 3.88% while the YTD return is -6.58% which is due to the volatility of the market. I am investing for longer term so I am not worried of this downturn. This is actually good time for me to invest.

The table below shows the dividends that I received in April 2020. I have done DRIP of all the dividends that I received. 


The following table shows the detailed performances of my portfolio. The current prices are based on April 30, 2020. In the chart, I have shared my current positions, annual income through dividends, total received dividends from each companies so far, cost basis, YOC, current yield, and finally the total gain or loss including the dividend income. My biggest gains so far is from MSFT then MA, V


The following treemap shows my gains in every sector under each stock. I have a huge gain in the tech sectors followed by financial and consumer defensive.


Monday, May 4, 2020

Monthly Dividend Update - April 2020

April 2020 - Monthly Dividend Update

Hello everyone, today I am sharing my updated dividend growth portfolio at the end of April. I always keep track of my investing portfolio in google sheet. It helps me to understand my portfolio performance so that I can make the right decision of my trades. Using the spreadsheets, I will always be updated of my investments past performance. I am saving 10% of my monthly salary for investing. I invest 80% of that salary to dividend growth stocks, 10% to non-dividend paying stocks such as Google, Amazon, Facebook, Tesla etc. The rest 10% I invest in cryptos mainly Bitcoin and Ethereum. This part of the quarter is the lowest income in dividends compared to the other months. I have trimmed my position in Jp Morgan Chase (JPM) in April. That is the reason my income in this part of the quarter dropped. 


The following chart shows the dividends receievd monthly from my portfolio. The chart indicates the growth of my monthly dividends with time. If I keep investing to these stocks, my income will only grow with time.

Monthly dividends received since June 2017


The following chart compares my monthly dividends on a yearly basis. In the last month, I have received $54.36 while in the same month in 2019 I received  $75 which is a sharp drop compared to the last year. I have sold some high yield dividend paying stocks that I was owning at this time last year. I have sold all of my positions in AGNC and NLY. They were paying high yields and I have decided to sell all of them.

Comparison of Monthly dividends received in each year


The next chart shows the total amount of dividends received on a quarterly basis. My previous two years had seen an increase in dividends every quarter. this year I am not so sure. Some of my holdings may cut their dividends partially and completely. So this year is going to show a lots of uncertainty. In Q1, I have seen a 24% YOY increase on a quarterly basis. However, in Q2 my income will drop because I have sold bank and energy stocks and also some of my holdings may cut dividends. 

Dividend Income on a Quarterly Basis

On a yield basis, the current yield of my overall portfolio is 3.11% while my yield on cost (YOC) is 3.82%. My YOC dropped a little because I have sold my entire position in BP and partially in JPM.

YOC vs. current yield with time

The chart below shows the average dividend income received monthly and the average amount of dividends received monthly. I am slowly increasing my passive income and if I continue to invest in the dividends-paying stocks it will only grow with time.


The chart and table below summarize my dividend distribution in the portfolio. The most percetages of dividends I am receiving are from Abbvie (ABBV), At&t(T), and 3M (MMM). They are covering almost 30% of my total dividend income. I have to diversify my positions that's why I will not add any more stocks from these 3 companies. I will look to add more stocks of Home Depot(HD) and Johnson & johnson (JNJ). 


The following tree map shows the dividends I am receiving from individual stocks and also compares between the sectors. I am getting the highest amount of dividends from the healthsector followed by the industrial sector and consumer cyclical.


The following table shows the dividends that I received from my positions in each month. This chart is very helpful to track my monthly income through dividends.


The next table shows the total amount of dividends received in 2020  from my stock positions. In April, I have received $54 and this chart will also help me to keep a record of my yearly income.

The next table shows my dividend growth performance in 2020. Out of my 36 stocks, 20 of them already increased their dividends this year while only 1 stocks (Volkswagen) suspended their dividends and The Kraft and Heinz (KHC) and Exxon Mobil (XOM) did not raise the dividends but maintaining the same amount of dividends. I cannot tell if all the companies will be able to keep their dividends safe. Last month Apple (AAPL) and Johnson and Johnson (JNJ) increased 6.5% and 6.3% dividends respectively.


Sunday, April 12, 2020

Portfolio Update - March 2020


Portfolio Update - March 2020

Today I am going to share my portfolio at the end of March 2020. This month we entered the bear market and my portfolio nose dived and I had to sell all of my remaining position of Delta Airlines (DAL) and also I have lowered my positions in the British Petroleum (BP) and Exxon Mobil (XOM) to raise some cash to buy some great stocks those I was waiting for an entry point for quite a long time. In February, I have sold all of my positions in Bank of America (BAC) at $34.5, 3/4 th of my JP Morgan (JPM) at $103, and Delta (DAL) at $46. I invested in DAL for a long time but I have decided to seel all because it will take them years to recover and the dividend is not going to come soon. because I am a dividend growth investor so I don't need to be invested for long in this stock. I was so lucky that I made a quick decision to sell most of my positions at $46. I sold my last few positions at $25. I raised a lot of cash in February by selling the stocks and I was holding around 10% cash in my brokerage account. I was so much active in the market around mid March and I think I made some great investment for the longer term. With those money I have opened my position in Starbux (SBUX) at $52, Disney (DIS) at $92, Cater Pillar (CAT) at $97, Realty Income (O) at $47, Store Capital (STOR), Duke Energy (DUK) at $74, and Southern Co (SO) at $44 in March. I have also added McDonald's (MCD) at $130, Cisco (CSCO) at $37, Leggett & Platt (LEG) at $23, Johnson & Johnson (JNJ) at $123, Emerson (EMR) at $46, Honeywell at $117, 3M (MMM) at $138, PPL at $26, and At&t (T) at $27. At the end of this blog you will see my overall portfolio. Below is the table that shows my portfolio distribution:


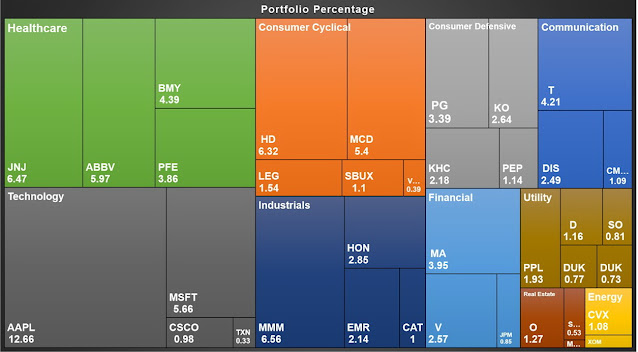
The same table is shown as a pie chart. I have invested in Apple (AAPL) in 2018 December and since then it sky rocketed. I am adding any more AAPL as I am holding more than 10% in my portfolio. I am also not going to invest in MMM anymore. I will add more positions in JNJ, HD, and MCD if I get them cheap. Microsoft(MSFT) is looking expensive right now. I will also add more DIS, CAT, and HON. I am also keeping an eye on O, STOR, DUK, and SO stocks.


The sector distribution of my portfolio is shown in the following pie chart. The sectors are based on Yahoo Finance. Currently, my highest position is in the health sector with 20% of my portfolio. I just invested in JNJ this month but the increase is because I have lowered my positions significantly in the financial and the energy sector. My second highest sector is the technology sector with 18%. The technology performed better in March and I have added more CSCO stocks. 
I always update my transaction in the tipranks website and the figure below compares my portfolio performance against the S&P 500. In most of the cases my portfolio beat the market.


My performance as a portfolio manager is also not bad. At then end of March I was ranked 1530 out of 24989 managers which is at the top 6%. My portfolio has gained 26.05% since I started to invest since 2017 August. Last month my gain was 69%. Last months bear market brought my gain down to 26%. My sharpe ratio is 0.81 while the average tiprank managers is -0.27.


My 12 month returns (TTM) is -6.07% while the YTD return is -19.5%. There may be more down turn in my portfolio but I am investing for long term so I should not be worried about this roller-coaster type movement.


The meter below shows my projected income in terms of dividends. On 31st March 2020, my projected income through dividends were $1118.99. It dropped from my last month because I have sold some high yield oil shares and holding cash. This income may drop more because some of the companies may cut their dividends.


My current yield on cost (YOC) is 3.84% while my current portfolio yield 3.54%. Because I am investing in dividend growth stocks so my YOC will continue to grow with time while the current yield depends with the market volatility. The yield will go up when the market is down and the vice versa.


The following figure shows the comparison of my current yield and YOC with time. Because the market dropped a lot, that's why the current yield is going up. This signals a buying opportunity in the market. For the longer term, if I keep investing in dividend growth stocks, my YOC will keep growing with time.


The following chart shows my growth in projected annual income with time. It is slowly but steadily increasing and this month I have received my highest earning so far through dividends.


The table below summarizes the dividends that I received in March 2020. This month I have received $144.16. My highest paying dividend paying stock for this part of the quarter was BP. Then MMM, HD, JNJ, XOM, and PFE. 


The following table shows the detailed performances of my portfolio. The current prices are based on March 31st, 2020. In the chart, I have shared my current positions, annual income through dividends, total received dividends from each companies so far, cost basis, YOC, current yield, and finally the total gain or loss including the dividend income. The top 4 stocks that I gained the most so far is MSFT 91%, MA 64%, PG 55%, and AAPL 54%. Currently, I am in the downside in all the oil stocks. I am more than 30% down in XOM, BP, and CVX.


Thursday, February 27, 2020

Portfolio Update - January 2020


Portfolio Update - January 2020

Today I am sharing my portfolio at the end of January 2020. This blog was written two weeks ago. I was very busy in the last few days so at the current situation of the market the prices of the stocks has a big difference. I will update my current portfolio as soon as possible. As of January I was holding 33 stocks. This month I have sold all of my positions in L Brands (LB). I sold them at $23.4 at the end of January which I bought at $17.4 in November 2019. I got 35% profit in just 2 months of holding. The chart below shows my current portfolio and sector distribution of the portfolio.


The pie chart below shows diversity. The chart indicates a well-diversified portfolio with Apple (AAPL) is my highest position. I bought them in December 2018 and since then it keep increasing. My other top holdings are JP Morgan (JPM) 5.9%, Home Depot (HD) 5.6%, Abbvie (ABBV) 5%, and J&J (JNJ) 4.8%. 

The sector distribution of my portfolio is shown in the following pie chart. The sectors are based on Yahoo finance. My highest position is in the consumer sector with 19.9% (combined). My next large sectors are the technology, financial, and health sectors with 16% each.


I always update my trades in the tipranks website. The figure below compares my portfolio performance against the S&P 500. Most of the cases my portfolio beats the market.

My performance as a portfolio manager is also good. I am ranked 725 out of 23,372 investors which is in the top 3%. My portfolio has gained 69% since I started to invest in the market in 2017 and my sharp ratio is 3.04 while the average is only 0.99. The sharpe ratio is "A measure of your returns and associated risk you take on compared to returns of risk-free assets".


My 12 month returns (TTM) is 30.84% while the YTD return is 7.97%. At the time of writing of the blog the market tumbled almost 10%. So this chart does not count the last 2 days drop.


The meter below shows my projected income in terms of dividends. On 31st January 2020, my projected income through were $1214.38. I have accomplished my first target of earning $100 monthly through dividends. My dividend income increased 3.4% compared to the last month. I have added some oil stocks in this month such as British Petroleum (BP), Chevron (CVX), and Exxon Mobil (XOM). All the oil stocks are down big and I am bullish about the future outlook of this sector. On the other hand I have sold my positions in Gaps (GPS) and L Brands (LB). I have got some nice profit from these two stocks in just 2 months of investment.


My current Yield on cost is 3.78% while my current portfolio yield is 2.99%. Because I am investing in dividend growth stocks so my YOC will continue to grow with time while the current yield depends with the market volatility. The yield will go up when the market is down and the vice versa.


The following figure shows the comparison of my current yield and the YOC with time. My YOC is higher than the current yield because of the bullish market. For longer term, if I keep investing in dividend growth stocks, my YOC will keep growing with time.


The following chart shows my growth in projected annual income with time. It is slowly but steadily increasing and this month it reached to my first goal of earning $100 per month.


The table below summarizes the dividends that I received in January 2020. This month I have received $62.34. My highest paying dividend paying for this part of the quarter is from Jp Morgan Chase ($16.24).


The following table shows the detailed performances of my portfolio. The current prices are based on January 31st 2020. So the prices do not reflect the current price in the market. In the chart, I shared my current positions, annual income that I will receive in a year, total recieved dividends from the companies, and finally the gain or loss for each company. Please note that I have added the total dividends received to calculate the gain or loss for each company. The top 3 stocks in terms of gain are Mastercard (MA), Microsoft (MSFT), and Apple (AAPL).


Sunday, January 5, 2020

Monthly Dividend Update December 2019

December 2019 - Monthly Dividend Update

In December 2019, I have received a total of $119.65 in dividends. The chart below shows the amount of money received in dividends each month in 2019. This month was the highest amount I received since I started to invest. This month my dividend increased from $101.56 to $119.65 which is a 17.8% increase compared to the last quarter (September). The increase is due to the addition of Exxon Mobil (XOM) in my portfolio. I have also purchased a few stocks of Johnson & Johnson (JNJ), 3M (MMM), and Emerson Electric (EMR). Other than that my income also increased because of the dividend increase from Pfizer (PFE), Microsoft (MSFT), McDonald's (MCD), and Visa (V). On the other hand, I have sold half of my positions in Honeywell (HON). Because of this, my dividend decreased a little bit. 


The next table shows the total dividends received in 2019 from my portfolio. In total, I have received $968.59 in the year. Last year I received $422 in dividends. So this year I have doubled my income.


The next table shows my dividend growth performance in 2019. The last column of the chart shows the change in dividends compared to the previous year. The box marked green indicates the percentage of dividends increased in the current year while the box with red means a decrease in dividends this year. In the last month, I got dividend raise from Bristol-Myers (BMY) 9.8%, Dominion Energy (D), 2.5%, Iron Mountain (IRM) 1.23%, Mastercard (MA) 21.2% and At&t (T) 2%. The increase in dividends raised $8 income in a year. In 2019, I got raised from all the companies except The Kraft & Heinz (KHC).


The chart and table below summarize my dividend distribution in the portfolio. The most percentages of dividends I am receiving are from ABBV and T. I need to diversify my dividend income. I am receiving most of my dividends from a few companies. Specifically, I am worried about KHC. They may cut the dividends again this year. Currently, it is 5.4% in my portfolio. So like last year it may significantly lower my income.

The following chart shows the dividends received monthly from my portfolio. The chart clearly indicates the growth of my monthly dividends with time.


The following chart compares my monthly dividends on a yearly basis. In the last month, I have received $119.65 while in 2018 in the same month I received $82.36 which is 45.28% YOY growth.


The next chart shows the total amount of dividends received on a quarterly basis. This year, the first three quarters remained the same. However, This quarter my income increased compared to the last quarter.  This quarter my income is $270.17 which is 17.07% growth. Again, compared to 2018 Q4 it increased by 42.47%. 


My current yield is 2.93% and my yield of cost (YOC) is 3.75%. This month my YOC increase because of my investment in new stocks which has high yields and also due to the increase in dividends to a few positions in my portfolio.


My projected annual dividends in December 2019 is $1174.76. This month I got a $100 increase in yearly income through dividends. I have added three new positions in my portfolio. I will write about those new additions in my next blog.


The chart below shows the average dividend income received monthly. My average income is almost reaching my first goal of receiving $100 monthly.