Showing posts with label long term investing. Show all posts

Sunday, June 5, 2022

Dividend Income Update May 2022

 Dividend Update May 2022


Hello Guys, today I am sharing the total amount of dividends I that I have received in May 2022. Currently, I am maintaining four different portfolios. My main portfolio is dividend paying stocks as my focus is in dividend paying stocks only. I also maintain a non-dividend paying stocks with massive growth. I invest in AMZN, GOOG, FB, NVDA, and TSLA. My third portfolio is the crypto currencies. Currently it got hammered but in the last year I have got enough profit from the cryptos. I have gradually started to buy cryptos again. My plan is to hold all the stocks for longer time. After my retirement I will sell all the non-dividend paying stocks and will invest those money to buy only dividend paying stocks to get a good monthly income during my retirement. In May, I was active in the market as I have added $SBUX, $JPM and $MPW in my dividend portfolio. In my non-dividend portfolio I have sold out $TWTR and with that money I have added $GOOG, $AMZN, and $NVDA. The table below shows the dividends I have received in May.


In the last month, I have received $122.5 in dividends. I have received $39 from $ABBV followed by $VZ ($14), $BMY ($14), $APPL ($14), and $T ($12). I used to received a big amount of dividends from $T but unfortunately they have slashed the dividends 50%. In the coming months I will add $SBUX and $JPM stocks. 

The next chart shows monthly dividend track sheet in a year. It helps me to understand how my dividends are being distributed monthly.

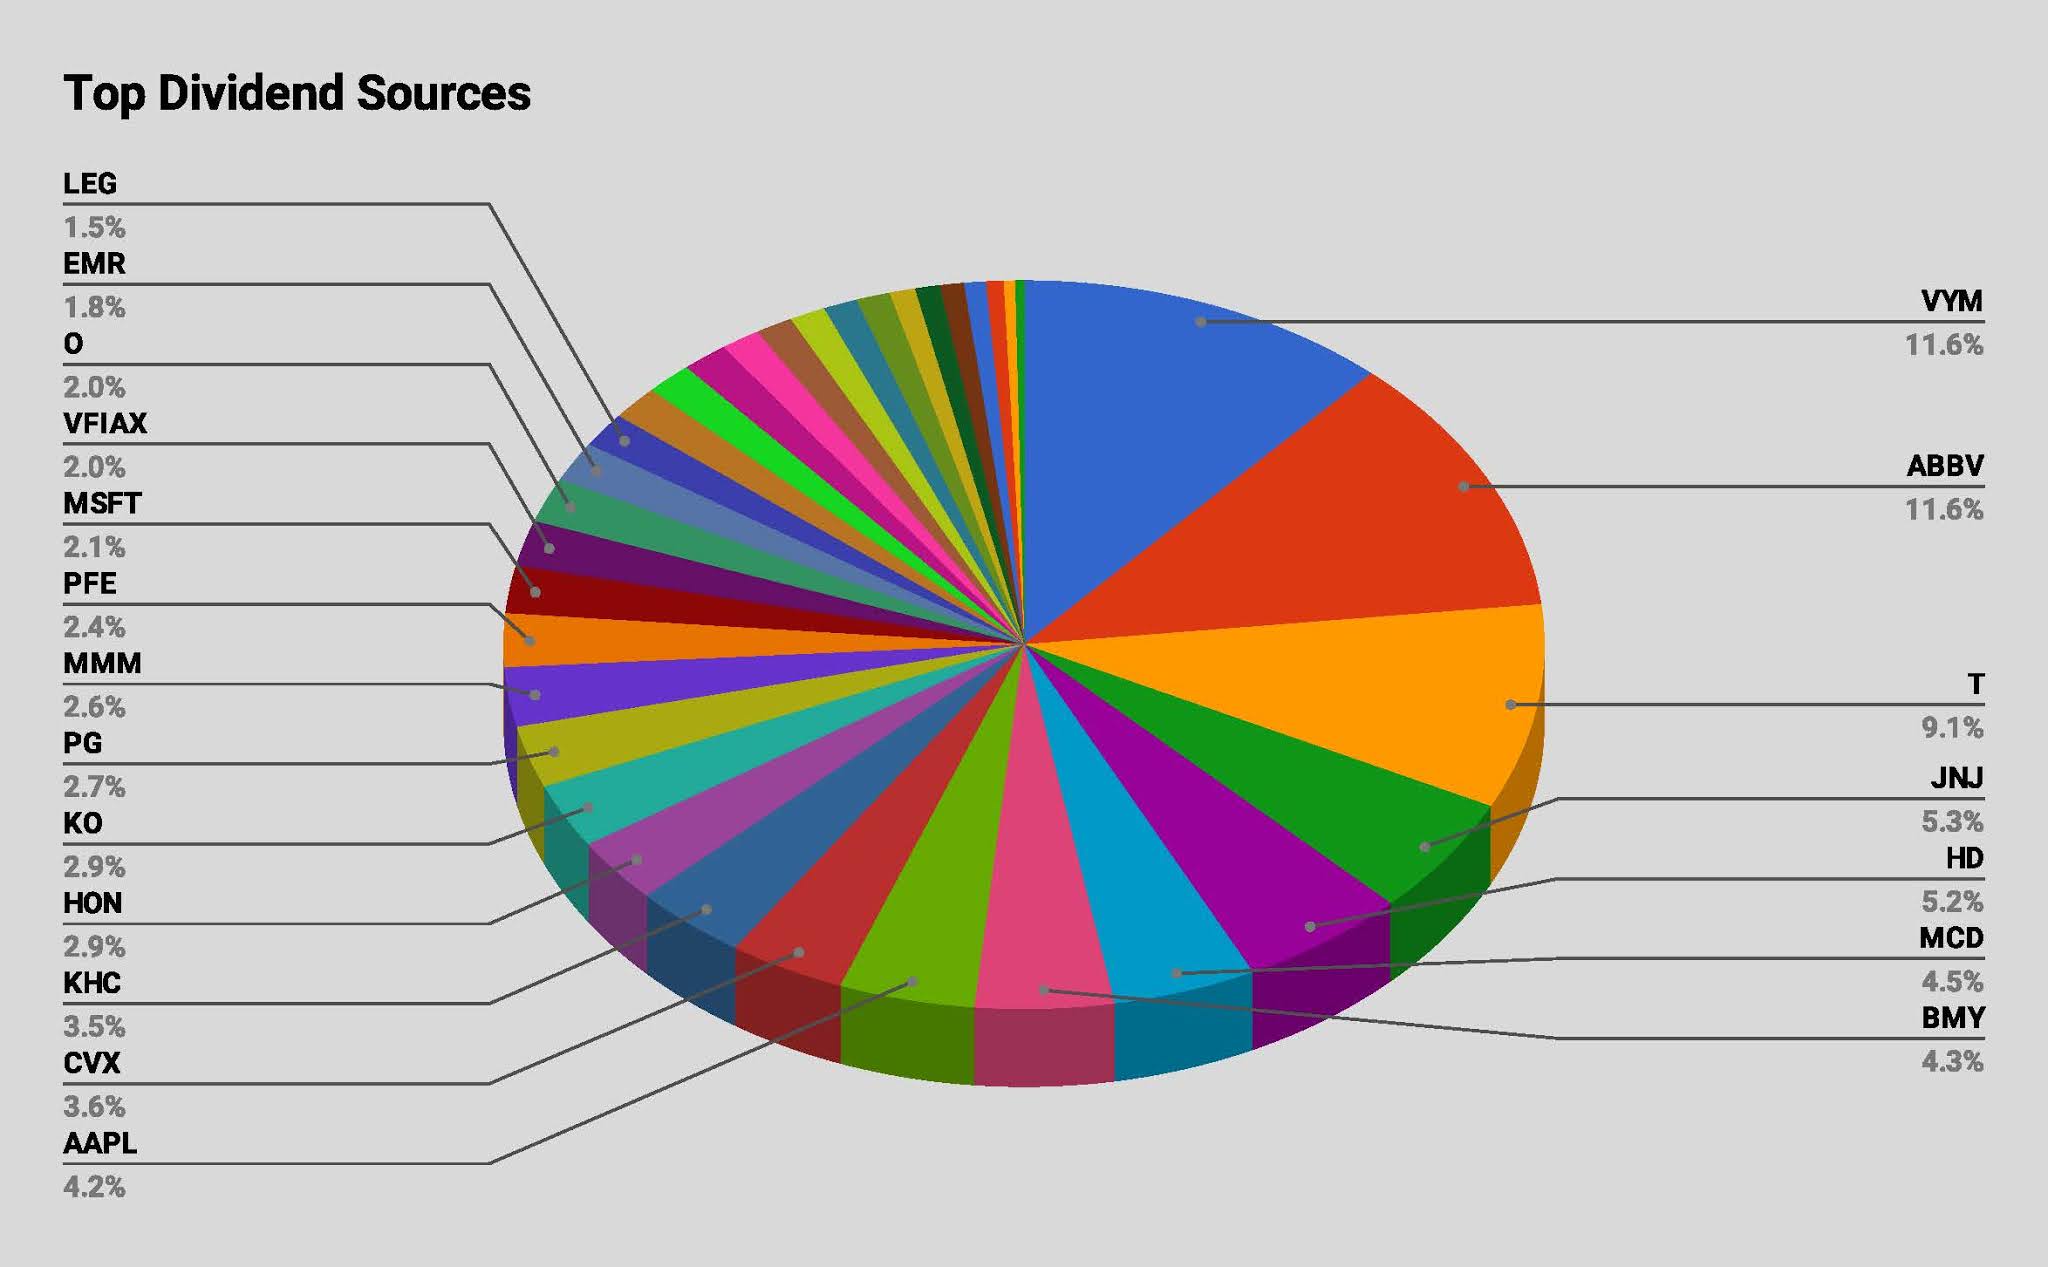
The chart and the table below summarizes my dividend distribution in the portfolio. The most percentages of dividends I am receiving are from the ETFs (SCHD and VYM). From individual stocks, I am receiving dividends from ABBV, JNJ, MMM, UL, PEP, HD etc.  


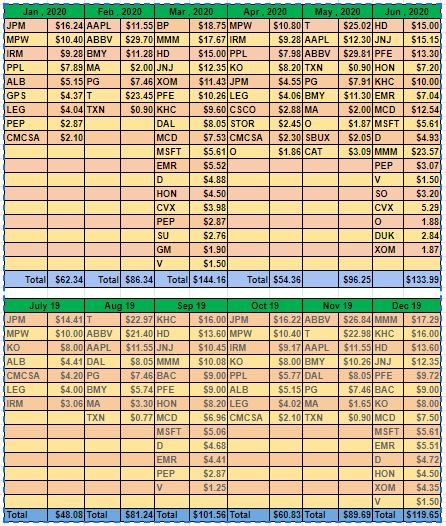
The table below shows the detailed distribution of my total dividends.


The dividends that I have received in May, did the DRIP for all of them. The following chart shows how my dividends are growing with time.


The chart below shows the average dividend income and the average amount of dividends received monthly. You will see that my dividend income is increasing with time (red color). 


The chart below shows the comparison of my monthly dividends on a yearly basis. The dividends are growing every year as I am adding new stocks and each company is increasing dividends on an avg of 6-7% a year. If I keep investing for longer run, just think about how much money this portfolio will generate. All you need is the patience. 


The next chart shows the total amount of dividends received in each quarter and compares the total amount of dividends with the previous years. 


On yield basis, the current yield of my overall portfolio is 2.53% while my YOC is 3.49%. The increase in YOC is because of the increase in dividends by each company. This yield only increase with time unless a company cuts the dividend. So it is very important to invest in only great companies. The current yield is dependent with he market. In bull market the yield drops while in the bear market the yield goes up.


The following curve shows the YOC and the current yield comparison with time. The YOC is gradually increasing as the companies are increasing their dividends annually.


Monday, January 4, 2021

Monthly Dividend Update - December 2020

 Monthly Dividend Update - December 2020

Hey what's up guys. Today I am going to share my updated dividend growth portfolio at the end of December 2020. In December, I have sold my entire position in the tanker company Nordic American Tanker (NAT) and initiated new position in Kimberly Clark (KMB). This is a great company for long term play and definitely a recession proof stock. I am slowly growing my positions in the dividend paying stocks. The ETFs that I am holding are part of my retirement account. In the future I am planning to add a few VOO shares in the retirement portfolio. The table below shows the dividends that I received in December 2020.


     The following chart shows the dividends received monthly from my portfolio. The chart indicates the growth of my monthly dividends with time. If I keep investing in these stocks, my income will grow with time. This part of the quarter gives me the highest income. My income from the last quarter dropped because NAT lowered their dividends 80%. They pay dividends cyclically. I have sold all of my positions in NAT.


     The following chart compares my monthly dividends on a yearly basis. In the last month, I have received $168.68 while last year in the same month I received around $120.


     The next chart shows the total amount of dividends received in each quarter and compares the total amount of dividends with the previous years.


On a yield basis, the current yield of my overall portfolio is 2.53% however my yield on cost (YOC) is 3.84%. The YOC will continue to increase because the dividend paying stocks always increase their dividends yearly so the YOC will only increase with time. On the other hand, the current yield depends on the market. If the market is in bull mode then the yield will drop and it will increase when the market is in bear mode.


     The following figure shows the YOC and current yield comparison with time. My YOC is gradually increasing while the current yield fluctuated in the same range which is dependent on the market condition. Currently the market is in bull mode so the current yield is dropping but the YOC is increasing because of the dividend increase from the companies. 


     The chart below shows the average dividend income received monthly and the average amount of dividends received monthly. I am slowly increasing my passive income and if I continue to invest in the dividend paying stocks it will only grow with time.


     The chart and table below summarizes my dividend distribution in the portfolio. The most percentages of dividends I am receiving are Vanguard High Yield (VYM), Abbvie (ABBV), At&t (T), Johnson & Johnson (JNJ) etc. They are the sources of 35% of my total dividend incomes. I have to buy other dividend paying stocks to balance the dividend distribution.


     Table:


     The following tree map shows the percentage of dividends that I am receiving from the individual stocks and also compares between the sectors. It helps me to understand which sectors are paying me the most in dividends. The map shows that I am getting the highest amount of dividends from the health sectors followed by the ETFs and consumer cyclical.


     The following table shows the dividends that I received from my positions in each month. This chart is very helpful to track my monthly income through dividends.


     The next table shows the total amount of dividends received in 2020 from my stocks positions. In December 2020, I have received $168.68. In 2020, I have received $1190 in dividends.


     The next table shows my dividend growth performance in the year. Out of all of my positions, none of my holdings cut their dividends surprisingly. Only 4 of them did not raise their dividends. Among them At&t and Leggett & Plat did not raise who has good record of increasing dividends.


Thursday, December 17, 2020

My dividend earnings in November 2020

 Monthly Dividend Update - November 2020

Hello everyone, today I am sharing my updated dividend growth portfolio at the end of November 2020. Last two months I did not update my portfolio because I was busy of buying my first home. I could not resist myself of buying my first ever home with a very low interest rate. Additionally, I had to sell some of my stocks to cover my closing costs and other expenses. I got a loan with 2.87% fixed rate interest conventional loan. I have sold all of my positions to PPL and a major portion of Pfizer (PFE) and 3M (MMM) back in October. All of my investments are for the longer term but this time I had to sell the positions. As I have mentioned in my previous blogs, I invest 10% of my salary in every month. Out of that money, 80% goes to dividend paying stocks, 10% in non-dividend paying stocks, and 10% in the cryptos. In the last two months I only bought At&t (T) stocks when it was really cheap. I bought them around $27. In my retirement accounts I have added a few Vanguard High Yield (VYM). The table below shows the dividends that I received in November 2020


       The following chart shows the dividends received monthly from my portfolio. The chart indicates the growth of my monthly dividends with time. If I keep investing in these stocks, my income will grow with time.


     The following chart compares my monthly dividends on a yearly basis. In the last month, I have received $87 while last year in the same month I received $89. I have sold some stocks in this year
, that's why the earnings dropped a little bit. 


     The next chart shows the total amount of dividends received in each quarter and compares the total amount of dividends with the previous years. 


     On a yield basis, the current yield of my overall portfolio is 2.73% while my Yield on Cost (YOC) is 4.05%. The YOC will continue to increase because the dividend paying stocks always increase their dividends yearly so the YOC will only increase with time. On the other hand, the current yield depends on the market. If the market is in bull mode then the yield will drop and it will increase when the market is in bear mode.


     The following figure shows the YOC and current yield comparison with time. My YOC is gradually increasing while the current yield fluctuated in the same range which is dependent on the market condition.


     The chart below shows the average dividend income received monthly and the average amount of dividends received monthly. I am slowly increasing my passive income and if I continue to invest in the dividend paying stocks it will only grow with time.


     The chart and table below summarizes my dividend distribution in the portfolio. The most percentages of dividends I am receiving are from Abbvie (ABBV), Vanguard high yield (VYM), and At&t (T). They are the source of more than 30% of my total dividends.


    The following tree map shows the percentage of dividends that I am receiving from the individual stocks and also compares between the sectors. It helps me to understand which sectors are paying me the most in dividends. The map shows that I am getting the highest amount of dividends from the health sectors followed by the industrial sectors.

    The following table shows the dividends that I received from my positions in each month. This chart is very helpful to track my monthly income through dividends.

    The next table shows the total amount of dividends received in 2020 from my stocks positions. In November 2020, I have received $87. So far in 2020, I have received $1022 in dividends.


The next table shows my dividend growth performance in the year. Out of all of my positions, none of my holdings cut their dividends. Only 4 of them kept the dividends same otherwise all of them increased their dividends in 2020.


Saturday, September 12, 2020

My passive earnings in August 2020

 Monthly Dividend Update - August 2020

    Hello everyone, today I am sharing my updated dividend growth portfolio at the end of August 2020. I always keep track of my investment portfolio in google sheet. It helps me to understand my portfolio performance so that I can make the right decision of my trades and in which direction my portfolio is going. For the last two months I did not invest anything. There two reasons for that. First reason is that I am looking to purchase my first home. The interest rates are really low and I am looking for a conventional loan with a fixed rate for 30 years. And the second is that the market is for quite a long time.. I think it should drop significantly. I am investing only 10% of my salary for investing. My main investing strategy is to invest in dividend-paying stocks however, I also invest a very small percentages on non-dividend paying stocks and in the Cryptos. So every month out of that 10%, I invest 80% in dividend-paying stocks, 10% in non-dividend paying stocks, and 10% in crypto currencies. All of my investments are for the longer term. I don't sell stocks that often. In August, I did not purchase any stocks but I have purchased Vanguard High Yield (VYM) ETF in my retirement accounts. My employer buys Florida Retirement System mutual funds which I don't like. So I have transferred 40% of my fund to a self-brokerage account and purchased VYM. I have raised $103 in dividends by adding VYM to my retirement funds. I have also added my wife's retirement account and she is buying Vanguard Admiral (VFIAX) through her employer. In the last month I have received $97.28 in dividends. Most of the dividends came from Abbvie (ABBV) and At&t (T). I have also received dividends from Bristol Myers (BMY), Apple (AAPL), Starbux (SBUX), Procter & Gamble (PG), Caterpillar (CAT), and MasterCard (MA). I have reinvested all the dividends that I received.


    The following chart shows the dividends received monthly from my portfolio. The chart indicates the growth of my monthly dividends with time. If I keep investing in these stocks, my income will only grow with time.


    The following chart compares my monthly dividends on a yearly basis. In the last month, I have received $97.28 while in the same month in 2019 I have earned $81. 


    The next chart shows the total amount of dividends received on a quarterly basis. My previous two years have seen an increase in dividends every quarter.  This year my income drops a little bit because I have sold my entire positions in BAC, JPM, and IRM. All the companies reported lower earnings but unfortunately the market is continuing its positive trend. The PE is going up so as the payout ratios. 


    On a yield basis, the current yield of my overall portfolio is 3.32% while the YOC is 4.01%. The YOC is higher than the current yield because the companies in my portfolio increase their dividend payouts on a yearly basis. So for the longer run, the YOC will only keep going up unless any company cut their dividends. 


    From the following curve, we can see a comparison of the current yield vs. the YOC and it is clear that the YOC is slowly increasing with time.


    The chart below shows the average dividend income received monthly and the average amount of dividends received monthly. I am slowly increasing my passive income and if I continue to invest in the dividend-paying stocks it will only grow with time.


    The chart and table below summarize my dividend distribution in the portfolio. The most percentages of dividends I am receiving are from Abbvie (ABBV), At&t(T), Vanguard High Yield (VYM), and 3M (MMM). They are the source of more than 30% of my total dividends.


    The following treemap shows the dividends I am receiving from individual stocks and also compares between the sectors. I am getting the highest amount of dividends from the health sector followed by the industrial, and consumer cyclical. 


    The following table shows the dividends that I received from my positions in each month. This chart is very helpful to track my monthly income through dividends.


    The next table shows the total amount of dividends received in 2020 from my stocks positions. In August I have received $97.28 and in 2020 I have received $711 in dividends. 


    The next table shows my dividend growth performance in the year. Out of 36 stocks 17 of them increased their dividends while BP is the only stock who cut their dividends to half.


Wednesday, July 8, 2020

Monthly Dividend update June 2020

Monthly Dividend update June 2020

    Hello everyone, today I am sharing my updated dividend growth portfolio at the end of June 2020. I always keep track of my investment portfolio in google sheet. It helps me to understand my portfolio performance so that I can make the right decision of my trades and in which direction my portfolio is going. I am not investing to retire early that's why I am saving monthly only 10% of my salary for investing. My main investing strategy is to invest in dividend-paying stocks however I also invest a very small percent in non-dividend paying stocks such as GOOGL, AMZN, TSLA, and FB and also in cryptocurrencies. I invest 80% in dividend-paying stocks, 10% in non-dividend paying stocks, and 10% in the crypto. All of my investments are in the long run. I don't sell stocks that often. In June, I have received $133.99 in dividends. Out of 35 stocks in my portfolio, 17 of them pay dividends in this part of the quarter. The highest amount of dividend I received from 3M (MMM), then followed by The Home Depot (HD), and Johnson & Johnson (JNJ). The following table summarizes the total amount of dividends that I received in June 2020. I am currently dripping 95% of my stocks except for NAT stocks.

        
Jun , 2020
HD$15.00
JNJ$15.15
PFE$13.30
HON$7.20
KHC$10.00
EMR$7.04
MCD$12.54
MSFT$5.61
D$4.93
MMM$23.57
PEP$3.07
V$1.50
SO$3.20
CVX$5.29
O$1.88
DUK$2.84
XOM$1.87
$133.99
           
    The following chart shows the dividends received monthly from my portfolio. The chart indicates the growth of my monthly dividends with time. If I keep investing in these stocks, my income will only grow with time.


         The following chart compares my monthly dividends on a yearly basis. In the last month, I have received $133.99 while in the same month in 2019 I received $83. My YOY growth is 60%.


    The next chart shows the total amount of dividends received on a quarterly basis. My previous two years have seen an increase in dividends every quarter. This year it may decrease as I have sold some stocks such as my bank stocks (JPM and BAC). Currently, I am holding cash because I am thinking the market is overpriced compared to the current economic conditions. The current PE and payout ratio is kind of meaningless as many companies are struggling in the current situation to survive and in my opinion, the PE and payout ratios will significantly increase when the companies will start to report their Q2 earnings from July 2020. 


    On a yield basis, the current yield of my overall portfolio is 3.13% and my Yield on Cost (YOC) is 4.05%. The YOC is higher than the current yield because the companies in my portfolio increase their dividend payouts on a yearly basis. So for the longer run, this YOC will only keep going up unless any company cut their dividends.


From the following curve, we can see a comparison of the current yield vs. the YOC and it is clear that the YOC is slowly increasing with time.


    The chart below shows the average dividend income received monthly and the average amount of dividends received monthly. I am slowly increasing my passive income and if I continue to invest in the dividend-paying stocks it will only grow with time.


The chart and table below summarize my dividend distribution in the portfolio. The most percentages of dividends I am receiving are from Abbv(ABBV), at&t (T), and 3M (MMM). They are covering almost 30 % of my total dividend income. I have to diversify my position that's why I will not add any more stocks from these 3 companies. I will look to add more stocks of The HomeDepot (HD) and Johnson & Johnson (JNJ).


The following treemap shows the dividends I am receiving from individual stocks and also compares between the sectors. I am getting the highest amount of dividends from the health sector followed by the industrial sector and consumer cyclical.


The following table shows the dividends that I received from my positions in each month. This chart is very helpful to track my monthly income through dividends.


        The next table shows the total amount of dividends received in 2020 from my stocks positions. 
In June I have received $133.99 and so far in 2020, my income is $577.
 

The next table shows my dividend growth performance in the year. Out of my 35 stocks, 21 of them already increased their dividends this year. No dividend cut so far. However, The Kraft & Heinz (KHC) and Exxon Mobil (XOM) did not raise their dividends.