Showing posts with label how to buy stocks. Show all posts

Wednesday, July 8, 2020

Monthly Dividend update June 2020

Monthly Dividend update June 2020

    Hello everyone, today I am sharing my updated dividend growth portfolio at the end of June 2020. I always keep track of my investment portfolio in google sheet. It helps me to understand my portfolio performance so that I can make the right decision of my trades and in which direction my portfolio is going. I am not investing to retire early that's why I am saving monthly only 10% of my salary for investing. My main investing strategy is to invest in dividend-paying stocks however I also invest a very small percent in non-dividend paying stocks such as GOOGL, AMZN, TSLA, and FB and also in cryptocurrencies. I invest 80% in dividend-paying stocks, 10% in non-dividend paying stocks, and 10% in the crypto. All of my investments are in the long run. I don't sell stocks that often. In June, I have received $133.99 in dividends. Out of 35 stocks in my portfolio, 17 of them pay dividends in this part of the quarter. The highest amount of dividend I received from 3M (MMM), then followed by The Home Depot (HD), and Johnson & Johnson (JNJ). The following table summarizes the total amount of dividends that I received in June 2020. I am currently dripping 95% of my stocks except for NAT stocks.

        
Jun , 2020
HD$15.00
JNJ$15.15
PFE$13.30
HON$7.20
KHC$10.00
EMR$7.04
MCD$12.54
MSFT$5.61
D$4.93
MMM$23.57
PEP$3.07
V$1.50
SO$3.20
CVX$5.29
O$1.88
DUK$2.84
XOM$1.87
$133.99
           
    The following chart shows the dividends received monthly from my portfolio. The chart indicates the growth of my monthly dividends with time. If I keep investing in these stocks, my income will only grow with time.


         The following chart compares my monthly dividends on a yearly basis. In the last month, I have received $133.99 while in the same month in 2019 I received $83. My YOY growth is 60%.


    The next chart shows the total amount of dividends received on a quarterly basis. My previous two years have seen an increase in dividends every quarter. This year it may decrease as I have sold some stocks such as my bank stocks (JPM and BAC). Currently, I am holding cash because I am thinking the market is overpriced compared to the current economic conditions. The current PE and payout ratio is kind of meaningless as many companies are struggling in the current situation to survive and in my opinion, the PE and payout ratios will significantly increase when the companies will start to report their Q2 earnings from July 2020. 


    On a yield basis, the current yield of my overall portfolio is 3.13% and my Yield on Cost (YOC) is 4.05%. The YOC is higher than the current yield because the companies in my portfolio increase their dividend payouts on a yearly basis. So for the longer run, this YOC will only keep going up unless any company cut their dividends.


From the following curve, we can see a comparison of the current yield vs. the YOC and it is clear that the YOC is slowly increasing with time.


    The chart below shows the average dividend income received monthly and the average amount of dividends received monthly. I am slowly increasing my passive income and if I continue to invest in the dividend-paying stocks it will only grow with time.


The chart and table below summarize my dividend distribution in the portfolio. The most percentages of dividends I am receiving are from Abbv(ABBV), at&t (T), and 3M (MMM). They are covering almost 30 % of my total dividend income. I have to diversify my position that's why I will not add any more stocks from these 3 companies. I will look to add more stocks of The HomeDepot (HD) and Johnson & Johnson (JNJ).


The following treemap shows the dividends I am receiving from individual stocks and also compares between the sectors. I am getting the highest amount of dividends from the health sector followed by the industrial sector and consumer cyclical.


The following table shows the dividends that I received from my positions in each month. This chart is very helpful to track my monthly income through dividends.


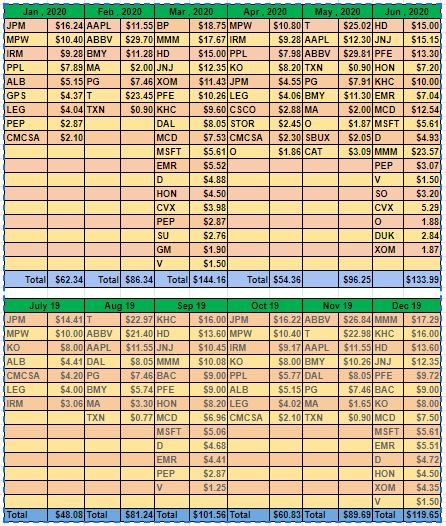
        The next table shows the total amount of dividends received in 2020 from my stocks positions. 
In June I have received $133.99 and so far in 2020, my income is $577.
 

The next table shows my dividend growth performance in the year. Out of my 35 stocks, 21 of them already increased their dividends this year. No dividend cut so far. However, The Kraft & Heinz (KHC) and Exxon Mobil (XOM) did not raise their dividends.


Sunday, February 9, 2020

Monthly dividend update - January 2020


January 2020 - Monthly Dividend Update

In January 2020, I have received a total of $62.34 in dividends. The table below shows the amount of dividends that I have received from the companies. This part of the quarter I receive the least amount of dividends. My highest paying company is JP Morgan (JPM) stock then followed by Medical Properties (MPW). This month my YOY is only 13%. I have added a few stocks of PPL corp and added GAP Inc (GPS) for a short time. Because of the addition, my dividends increased from the last quarter. 


The following chart shows the dividends received monthly from my portfolio. The chart clearly indicates the growth of my monthly dividends with time.


The following chart compares my monthly dividends on a yearly basis. In the last month, I have received $62.34 while in the same month in 2019 I received $54.7 which is 13% YOY growth in income through dividends.


The next chart shows the total amount of dividends received on a quarterly basis. My previous two years had seen an increase in dividends every quarter. This year I am also expecting a similar increase in dividends. 


On a yield basis, the current yield of my overall portfolio is 2.99% while my yield on cost (YOC) is 3.78%. For a dividend investor like me, YOC is an actual yield than the current yield. The current yield varies with the market condition. The bull market moves the yield lower and vice versa for the bear market. However, the YOC only increases with time if you invest in dividend growth stocks. If you only invest in these types of companies your YOC will only increase with time. 


My projected annual income in January 2020 is $1214.38. This month my dividend income increased by $40 in total. This is the first time my annual income crossed $1200 limit which was my first goal to earn $100 monthly from dividend income. That's a real passive income. I will keep investing every month and just imagine how much my monthly income will grow as time passes by.


The chart below shows the average dividend income received monthly and the average amount of dividends received monthly. I am slowly increasing my passive income and if I continue to invest in the dividend-paying stocks it will only grow. At the time of retirement, I don't need to rely only on my social security income.


The chart and table below summarize my dividend distribution in the portfolio. The most percentages of dividends I am receiving are from ABBV and T. I also invested in BP this month so my 3rd highest paying dividend stock is BP. I am planning to add more BP this month. I am also worried about the Kraft & Heinz (KHC) stock. They lowered their dividends last year and some analysts are saying that they will again lower the dividends. If they again decrease then my income will be lower. Its dividend safety score is only 29 so there is a high chance that they will cut their dividend again. So I am planning to make my position to less than half and will buy BP with that money. 


The following table shows the dividends that I received from my positions in each month. In January 20 I have received dividends from JPM, MPW, IRM, and PPL mostly. 


The next table shows the total dividends received in 2020 from my positions. So far this month I have received $62.34. This chart will help me to keep a record of my yearly income.


The next table shows my dividend growth performance in 2020. Out of my 33 stocks, 10 of them already increased their dividends. Bristol-Myers Squibb (BMY) and Chevron (CVX) increased their dividends 9.8 and 8.4% respectively compared to the last years 4 and 6% increase. ABBV, Mastercard (MA), and Comcast (CMCSA) also increase their dividends 10.3%, 21.2%, and 9.5% respectively.


Tuesday, December 17, 2019

Portfolio Update November 2019


Portfolio Update on November 2019

Today I am sharing my portfolio at the end of November 2019. I am holding 30 stocks in my portfolio. I will hold all the stocks for a longer time. My main aim is to invest in dividend growth company stocks and reinvest all the dividends that I am receiving. Last month I did not purchase any new stocks. Currently, I am holding cash and want to wait until the market pullbacks. I actually love to time the market rather buying stocks at random prices. It's always good to buy stocks at a discounted price because purchasing stocks at a lower price gives you the chance to purchase more stocks and hence more dividends. The chart below shows my current portfolio and sector distribution of my portfolio.


The pie chart below shows diversity. The chart indicates a well-diversified portfolio with Apple (AAPL) is my highest position. Apple's recent surge increased my holding percentage a little high. My next big holdings are JP Morgan (JPM), Abbvie (ABBV), Home Depot (HD), and 3M (MMM).

The sector distribution of my portfolio has been shown in the following pie chart. The sectors are based on Morningstar. My highest position is in the consumer sector with 21%. My second and third largest positions are in the healthcare and financial sectors respectively. Recent bull case in the healthcare sector pushed my position in healthcare to second position. My position in tech sector also went up because of the jump in Apple and Microsoft stocks in my portfolio.


The meter below shows my projected income in terms of dividends. On November 30th my projected income through dividend was $1079.89. I have set my first target to $100 per month from dividends which is $1200 per year. Compared to last month my dividend increased from $1068.32. The increase in dividends is due to the 10% increase in dividends from Abbvie (ABBV). 


The current yield of my portfolio is 2.91% while my Yield of cost (YOC) is 3.6%. 


The following figure shows the comparison of my current yield and the YOC with time. It shows that the YOC of my portfolio is going up while my current yield is below the YOC. Because I invest in dividend growth stocks that's why my YOC will keep increasing with time. However, Current yield depends on the market volatility. If the market is up the yield drops and if the market is down then the yield increases.


The following chart shows my growth in projected annual income with time. It is slowly but steadily increasing and reaching to achieve my first goal. 


The table below summarizes the dividends that I received in November 2019. This month I have received dividends from the top 2 largest paying companies Abbvie (ABBV) and At&t (T).

The following table shows the detailed performances of my portfolio. The current prices are based on November 30th 2019. So these prices does not reflect the current price in the market. In the chart, I have shared my current positions, annual income that I will receive in a year, total received dividends from the companies, and finally the gain or loss for each company. Please note that I have added the total dividends received to calculate the gain or loss. I am gaining almost all the stocks except KHC and ALB. My biggest gains so far are Mastercard (MA), Microsoft (MSFT), Procter & Gamble (PG), and Visa (V). I am invested for a long term in all the companies. 


Tuesday, November 19, 2019

Portfolio update on October 2019


Portfolio update on October 2019


Today I am updating and sharing my portfolio for the month of October 2019. All the prices in this article are based on November 1st, 2019. Currently, I am holding 30 stocks in my portfolio. I am looking to add new stocks in my portfolio to diversify my portfolio but I cannot find any stocks which are at a big discount. In October, I added MMM stocks in my portfolio. The market is up like crazy and I don't want to invest in this market. I am holding cash and have decided to wait for the market pullback. The chart below shows my current portfolio and sector distribution. 


The pie chart shows my portfolio diversity based on sectors from Morningstar. My highest position is in the consumer sector followed by the financial and healthcare sectors. 

The following chart shows my portfolio diversity and you can see that I have built a well-diversified portfolio with Apple (AAPL) my highest position followed by Home Depot (HD) and JP Morgan (JPM).


The meter below shows my projected annual income in terms of dividends. On October 31st my projected income through dividend was $1068.32. I have set my first target to $100 per month from dividends which is $1200 per year. Compared to last month my dividend increased from $1048 to $1068. The increased of $20 is due to the purchase of Exxon (XOM), 3M (MMM) stock and reinvestment of dividends. 


The current yield of my portfolio is 2.92% and the yield of cost is 3.6%. 


The figure below shows the comparison of my current yield and YOC with time. The curve shows that my YOC is higher than my current yield. The current yield depends on the dividend rises or drops and also on the bear or bull market. If the market is in bull mode then the yield will drop and in the bear market, it is vice versa. The yield on cost depends on the dividend rise and cut. So for longer-term YOC will gain and will be well above the current yield.


The following chart shows my growth in projected annual income with time. It is slowly but steadily increasing and reaching to achieve my first goal.

The mini table below summarizes the dividends that I received in the month of October 2019. My month was mainly dominated by dividends from JPM and Medical Prop. (MPW).


The following table shows the detailed performances of my portfolio. The current prices are based on October 31st, 2019, so the prices will vary compared to the current market. From the chart, you can see that my biggest gained stocks are Mastercard (MA), Microsoft (MSFT), Procter & Gamble (PG), and Visa (V). The only two stocks that I am losing are Albemarle (ALB) and Kraft & Heinz (KHC). However, I am expecting of a positive run of these two companies in the near future.

Monday, October 21, 2019

Portfolio Update September 2019


Portfolio update on September 2019

Today I am updating and sharing my portfolio for the month of September 2019. All the prices in this article are based on October 1st, 2019. Currently, I am holding 30 stocks in my portfolio. This month I have added PPL Corporation (PPL) in my portfolio for the first time. I was looking for a utility stock at a cheaper price but unfortunately, most of the utility stocks are expensive. PPL looked to be a good utility stock with fair value. Its P/E ratio and the payout ratio is much lower compared to its peers. I added this stock after its ex-dividend date when the price dropped to $29. This is the only stock purchase I made this month. I haven't sold any stocks. I am investing defensively. I am waiting for a market pull-back that's why I am holding cash. 

Below is the pie chart of my portfolio diversity based on sectors from Morningstar. Last month I have my position in the utility stock. My highest position is in the consumer sector followed by the financial and healthcare sector. 

The chart below shows my portfolio diversity and you can see that Apple (AAPL), Home Depot (HD) and JP Morgan (JPM) are my majority holdings.

The meter below shows my projected annual income in terms of dividends. On September 30th my projected income through dividend was $1048.51. I have set my first target to earn $100 per month from dividends which is $1200 per year. In the previous month, my yearly income was $1010.42. So in one month, my income increased $38 (3.76%) which is mostly from the purchase of PPL stock. Other than that my other holdings such as McDonald's (MCD), Microsoft(MSFT), Texas Instruments(TXN), and Honeywell (HON) increased their dividends.


The current yield of my portfolio is 3.12% and the yield on cost (YOC) is 3.55% which is good for my target yield.

The figure below shows the comparison of my current yield and YOC with time. The curve shows that my YOC is higher than my current yield. The current yield depends on the dividend rises or drops and also on the bear or bull market. If the market is in bull mode then the yield will drop and in a bear market, the yield goes up. The yield on cost depends on the dividend rise and cut. So for long term scale YOC will gain and goes well above the current yield.


My projected annual income through dividends with time is shown in the following chart. My income is growing every month steadily.

The mini table below shows the dividends that I received in the month of September 2019. My month was mainly dominated by dividends from KHC, HD, JNJ, and MMM. 


The following chart summarizes the performance of my stocks. The prices are based on October 1st, 2019. So the prices will vary with the current market price. From the chart, you will see my biggest gained stocks are Mastercard (MA), Visa (V), Microsoft (MSFT), The Procter & Gamble (PG), and Apple (AAPL). Currently, only two stocks in my portfolio are lagging the market gain. These stocks are KHC and ALB. I am a long term for both the stocks. I am really confident that these stocks will bounce back in the future.