Showing posts with label financial freedom. Show all posts

Wednesday, December 28, 2022

Why you should invest in Dividend Paying Stocks


Why you should invest in Dividend Paying Stocks

Photo by Sortter on Unsplash

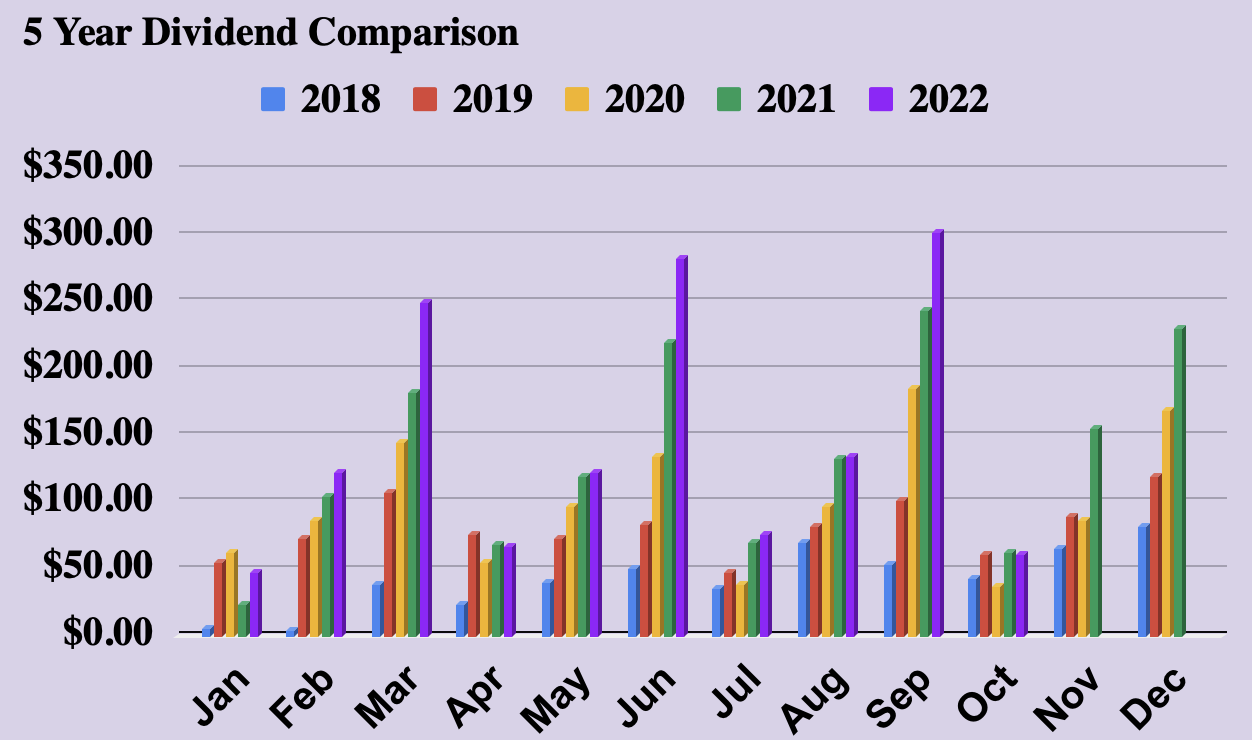
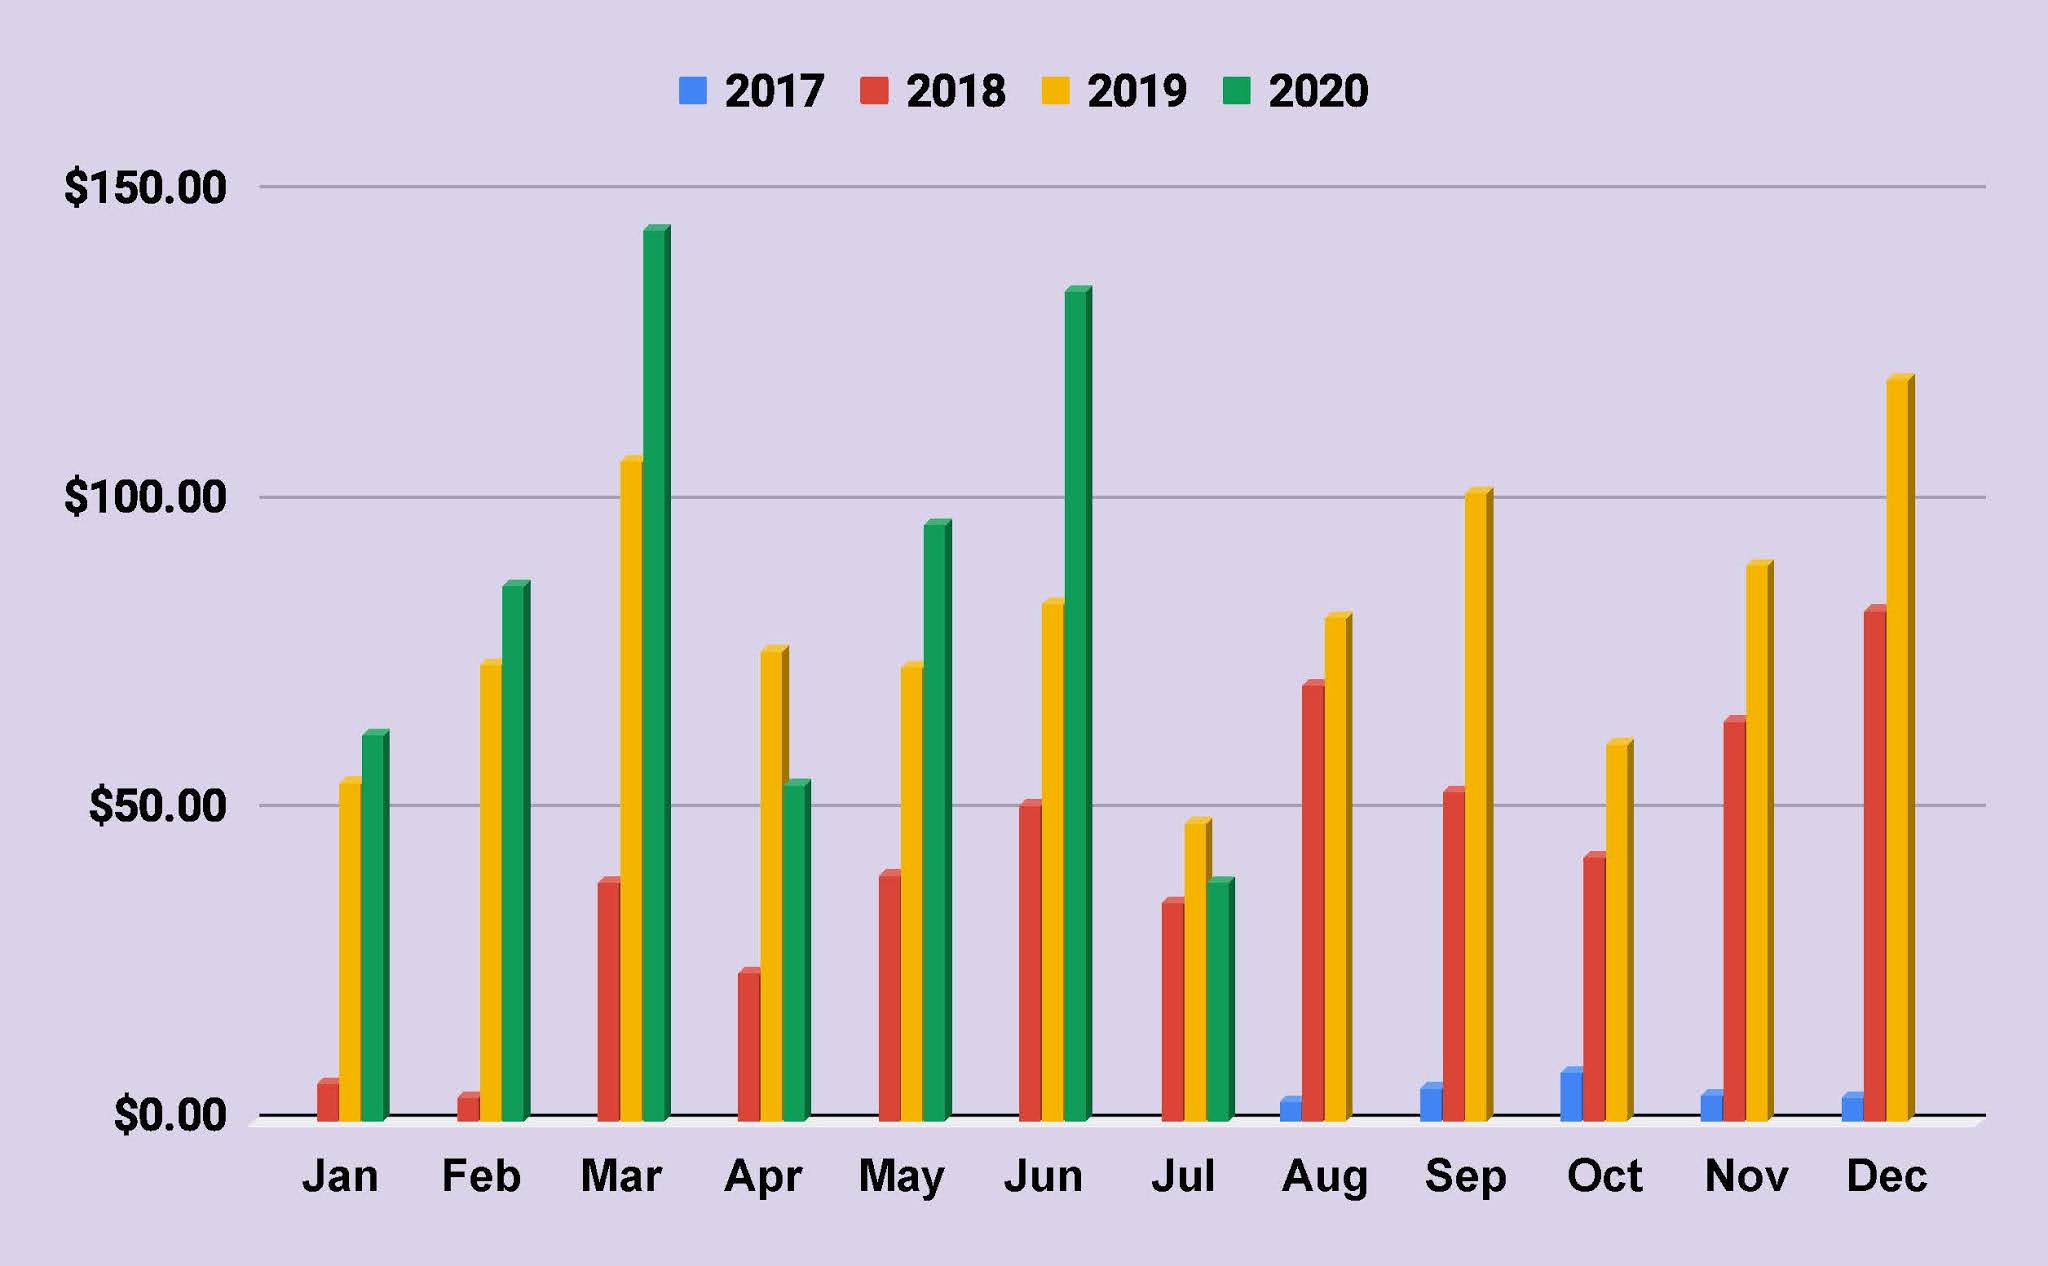
In this article, I want to show examples of how one can build wealth by investing in dividend-paying stocks over the long term by sharing the dividend income in my portfolio. I started investing in dividend-paying stocks in 2017 with no income from dividends. In 2022, I am earning $2,583 yearly from dividends. How much money am I adding monthly to my portfolio? I invest 10% of my salary in dividend stocks and reinvest all the dividends to buy back the stocks. The best part of dividend stocks is the yearly increase of dividend $ amounts and reinvesting dividends to buy additional stocks of the company’s stock which generates more income from dividends yearly. A good dividend company increases at least 5% dividends a year; some companies with high growth may increase by 20% or more. So on average, a dividend investor can see approximately ~7% increase in income from dividends which must be higher than your 9 to 5 job. To identify a good company that will keep increasing dividends, you must go through the company’s financial health and business model.

Why dividend stocks:

There are several reasons that tell why one should invest in dividend stocks:

  • Potential for long-term growth: Many dividend-paying stocks have a history of paying dividends for quite a long time. These companies have already established themselves as a stable and growing company. If one keeps reinvesting the dividends, one can benefit from compounding interest and long-term growth.
  • Regular source of income: The potential long-term growth dividend stocks will generate a much higher income in dividends with time which will be an attractive option for investors who are retired or looking for passive income.
  • Potential to outperform non-dividend-paying stocks: When we talk about investing for the longer term, it has been found that dividend-paying stocks outperformed non-dividend-paying stocks.

Identifying the stocks:

I follow a few simple steps to identify good dividend-paying stocks that will keep increasing their dividends yearly.

  • Consistent in paying and increasing dividends: The first thing I look for in a dividend-paying stock is the company is consistent in paying dividends. A company that pays dividends consistently is more likely to continue paying dividends and keep increasing dividends in the future.
  • The dividend yield and payout ratio: The dividend yield and the payout ratio is very important for dividend investors. The dividend yield is the annual dividend per share divided by the stock price and the payout ratio is the percentage of a company’s earnings that are paid out as dividends. I always look for companies that pay a reasonable dividend yield and a payout ratio not higher than 80%.
  • PE ratio: Price to earning ratio is also another parameter to look into. It helps to identify if the stock price is fairly valued or not. For dividend investors, this is very important as if you buy at a lower PE ratio then you are buying at a higher yield and you are buying more stocks that will generate more dividend income.
  • Company’s financial health: Every investor should read the company’s financial statements that they are invested in. Look for the company’s profitability, debt levels, and cash flow. A company’s financial strength will indicate if it will be able to sustain and increase its dividends over time.
  • Company’s business model: Always look at the company’s business model and how it generates revenue. Also, understand the strength of the company’s competitive advantage and its potential for future growth.

The growth: Keep patience and hold your investment for long-term

There are several benefits of holding dividend-paying stocks for the longer term.

  • Potential for higher return: This is true for all types of stock investors. Over the long term, the stock market has historically generated higher returns than other asset classes such as bonds and cash. by investing for the long term, the investor can take advantage of these higher potential returns. Picking an excellent growth stock is very important in this case.
  • Time to weather market fluctuations: In the short term, the market can be volatile, but over the long term, it tends to go upward. By investing for the long term investors can ride out market fluctuations and potentially get a higher return. Most of the time it also beats inflations.
  • The benefit of compounding: In long-term investing in dividend-paying stocks, investors can potentially see the miracle of compounding interest. This is the process where the dividend is reinvested so that the investment earns more dividends from both the original principal and the accumulated dividends. This will help to grow wealth faster over time.
This blog was originally written on Medium by the author.

Saturday, November 12, 2022

My projected dividend growth since 2017


    Hello all, I am sharing my projected yearly income form dividends. I have started to invest in 2017. Since then I am investing in dividend paying stocks. The advantage of dividend investing is that I will have yearly income from my investment which I am reinvesting to grow my wealth and every company increase their dividends yearly. So more yearly income, more stocks, and more dividends.


    The above figure shows my current yearly income from dividends. In 2017, I had no income from dividends and now in 5 years I am earning $2,408 yearly. 


    The above figure shows how my income increased since 2017. There is a big drop in 2020 as I had to sell some shares to finance my first home. 


    The above chart shows my dividend income monthly in the last 5 years. You can clearly see that my income is keep increasing yearly. The simplest rule is to reinvest the dividends and keep addning more stocks monthly.


    The above figure shows my quarterly income since 2018. In 2018, I was earning only $100 per quarter and in 2022 I am earning more than $400 quarterly which is more than 4 times.

Monday, January 4, 2021

Monthly Dividend Update - December 2020

 Monthly Dividend Update - December 2020

Hey what's up guys. Today I am going to share my updated dividend growth portfolio at the end of December 2020. In December, I have sold my entire position in the tanker company Nordic American Tanker (NAT) and initiated new position in Kimberly Clark (KMB). This is a great company for long term play and definitely a recession proof stock. I am slowly growing my positions in the dividend paying stocks. The ETFs that I am holding are part of my retirement account. In the future I am planning to add a few VOO shares in the retirement portfolio. The table below shows the dividends that I received in December 2020.


     The following chart shows the dividends received monthly from my portfolio. The chart indicates the growth of my monthly dividends with time. If I keep investing in these stocks, my income will grow with time. This part of the quarter gives me the highest income. My income from the last quarter dropped because NAT lowered their dividends 80%. They pay dividends cyclically. I have sold all of my positions in NAT.


     The following chart compares my monthly dividends on a yearly basis. In the last month, I have received $168.68 while last year in the same month I received around $120.


     The next chart shows the total amount of dividends received in each quarter and compares the total amount of dividends with the previous years.


On a yield basis, the current yield of my overall portfolio is 2.53% however my yield on cost (YOC) is 3.84%. The YOC will continue to increase because the dividend paying stocks always increase their dividends yearly so the YOC will only increase with time. On the other hand, the current yield depends on the market. If the market is in bull mode then the yield will drop and it will increase when the market is in bear mode.


     The following figure shows the YOC and current yield comparison with time. My YOC is gradually increasing while the current yield fluctuated in the same range which is dependent on the market condition. Currently the market is in bull mode so the current yield is dropping but the YOC is increasing because of the dividend increase from the companies. 


     The chart below shows the average dividend income received monthly and the average amount of dividends received monthly. I am slowly increasing my passive income and if I continue to invest in the dividend paying stocks it will only grow with time.


     The chart and table below summarizes my dividend distribution in the portfolio. The most percentages of dividends I am receiving are Vanguard High Yield (VYM), Abbvie (ABBV), At&t (T), Johnson & Johnson (JNJ) etc. They are the sources of 35% of my total dividend incomes. I have to buy other dividend paying stocks to balance the dividend distribution.


     Table:


     The following tree map shows the percentage of dividends that I am receiving from the individual stocks and also compares between the sectors. It helps me to understand which sectors are paying me the most in dividends. The map shows that I am getting the highest amount of dividends from the health sectors followed by the ETFs and consumer cyclical.


     The following table shows the dividends that I received from my positions in each month. This chart is very helpful to track my monthly income through dividends.


     The next table shows the total amount of dividends received in 2020 from my stocks positions. In December 2020, I have received $168.68. In 2020, I have received $1190 in dividends.


     The next table shows my dividend growth performance in the year. Out of all of my positions, none of my holdings cut their dividends surprisingly. Only 4 of them did not raise their dividends. Among them At&t and Leggett & Plat did not raise who has good record of increasing dividends.


Thursday, December 17, 2020

My dividend earnings in November 2020

 Monthly Dividend Update - November 2020

Hello everyone, today I am sharing my updated dividend growth portfolio at the end of November 2020. Last two months I did not update my portfolio because I was busy of buying my first home. I could not resist myself of buying my first ever home with a very low interest rate. Additionally, I had to sell some of my stocks to cover my closing costs and other expenses. I got a loan with 2.87% fixed rate interest conventional loan. I have sold all of my positions to PPL and a major portion of Pfizer (PFE) and 3M (MMM) back in October. All of my investments are for the longer term but this time I had to sell the positions. As I have mentioned in my previous blogs, I invest 10% of my salary in every month. Out of that money, 80% goes to dividend paying stocks, 10% in non-dividend paying stocks, and 10% in the cryptos. In the last two months I only bought At&t (T) stocks when it was really cheap. I bought them around $27. In my retirement accounts I have added a few Vanguard High Yield (VYM). The table below shows the dividends that I received in November 2020


       The following chart shows the dividends received monthly from my portfolio. The chart indicates the growth of my monthly dividends with time. If I keep investing in these stocks, my income will grow with time.


     The following chart compares my monthly dividends on a yearly basis. In the last month, I have received $87 while last year in the same month I received $89. I have sold some stocks in this year
, that's why the earnings dropped a little bit. 


     The next chart shows the total amount of dividends received in each quarter and compares the total amount of dividends with the previous years. 


     On a yield basis, the current yield of my overall portfolio is 2.73% while my Yield on Cost (YOC) is 4.05%. The YOC will continue to increase because the dividend paying stocks always increase their dividends yearly so the YOC will only increase with time. On the other hand, the current yield depends on the market. If the market is in bull mode then the yield will drop and it will increase when the market is in bear mode.


     The following figure shows the YOC and current yield comparison with time. My YOC is gradually increasing while the current yield fluctuated in the same range which is dependent on the market condition.


     The chart below shows the average dividend income received monthly and the average amount of dividends received monthly. I am slowly increasing my passive income and if I continue to invest in the dividend paying stocks it will only grow with time.


     The chart and table below summarizes my dividend distribution in the portfolio. The most percentages of dividends I am receiving are from Abbvie (ABBV), Vanguard high yield (VYM), and At&t (T). They are the source of more than 30% of my total dividends.


    The following tree map shows the percentage of dividends that I am receiving from the individual stocks and also compares between the sectors. It helps me to understand which sectors are paying me the most in dividends. The map shows that I am getting the highest amount of dividends from the health sectors followed by the industrial sectors.

    The following table shows the dividends that I received from my positions in each month. This chart is very helpful to track my monthly income through dividends.

    The next table shows the total amount of dividends received in 2020 from my stocks positions. In November 2020, I have received $87. So far in 2020, I have received $1022 in dividends.


The next table shows my dividend growth performance in the year. Out of all of my positions, none of my holdings cut their dividends. Only 4 of them kept the dividends same otherwise all of them increased their dividends in 2020.


Saturday, September 12, 2020

My passive earnings in August 2020

 Monthly Dividend Update - August 2020

    Hello everyone, today I am sharing my updated dividend growth portfolio at the end of August 2020. I always keep track of my investment portfolio in google sheet. It helps me to understand my portfolio performance so that I can make the right decision of my trades and in which direction my portfolio is going. For the last two months I did not invest anything. There two reasons for that. First reason is that I am looking to purchase my first home. The interest rates are really low and I am looking for a conventional loan with a fixed rate for 30 years. And the second is that the market is for quite a long time.. I think it should drop significantly. I am investing only 10% of my salary for investing. My main investing strategy is to invest in dividend-paying stocks however, I also invest a very small percentages on non-dividend paying stocks and in the Cryptos. So every month out of that 10%, I invest 80% in dividend-paying stocks, 10% in non-dividend paying stocks, and 10% in crypto currencies. All of my investments are for the longer term. I don't sell stocks that often. In August, I did not purchase any stocks but I have purchased Vanguard High Yield (VYM) ETF in my retirement accounts. My employer buys Florida Retirement System mutual funds which I don't like. So I have transferred 40% of my fund to a self-brokerage account and purchased VYM. I have raised $103 in dividends by adding VYM to my retirement funds. I have also added my wife's retirement account and she is buying Vanguard Admiral (VFIAX) through her employer. In the last month I have received $97.28 in dividends. Most of the dividends came from Abbvie (ABBV) and At&t (T). I have also received dividends from Bristol Myers (BMY), Apple (AAPL), Starbux (SBUX), Procter & Gamble (PG), Caterpillar (CAT), and MasterCard (MA). I have reinvested all the dividends that I received.


    The following chart shows the dividends received monthly from my portfolio. The chart indicates the growth of my monthly dividends with time. If I keep investing in these stocks, my income will only grow with time.


    The following chart compares my monthly dividends on a yearly basis. In the last month, I have received $97.28 while in the same month in 2019 I have earned $81. 


    The next chart shows the total amount of dividends received on a quarterly basis. My previous two years have seen an increase in dividends every quarter.  This year my income drops a little bit because I have sold my entire positions in BAC, JPM, and IRM. All the companies reported lower earnings but unfortunately the market is continuing its positive trend. The PE is going up so as the payout ratios. 


    On a yield basis, the current yield of my overall portfolio is 3.32% while the YOC is 4.01%. The YOC is higher than the current yield because the companies in my portfolio increase their dividend payouts on a yearly basis. So for the longer run, the YOC will only keep going up unless any company cut their dividends. 


    From the following curve, we can see a comparison of the current yield vs. the YOC and it is clear that the YOC is slowly increasing with time.


    The chart below shows the average dividend income received monthly and the average amount of dividends received monthly. I am slowly increasing my passive income and if I continue to invest in the dividend-paying stocks it will only grow with time.


    The chart and table below summarize my dividend distribution in the portfolio. The most percentages of dividends I am receiving are from Abbvie (ABBV), At&t(T), Vanguard High Yield (VYM), and 3M (MMM). They are the source of more than 30% of my total dividends.


    The following treemap shows the dividends I am receiving from individual stocks and also compares between the sectors. I am getting the highest amount of dividends from the health sector followed by the industrial, and consumer cyclical. 


    The following table shows the dividends that I received from my positions in each month. This chart is very helpful to track my monthly income through dividends.


    The next table shows the total amount of dividends received in 2020 from my stocks positions. In August I have received $97.28 and in 2020 I have received $711 in dividends. 


    The next table shows my dividend growth performance in the year. Out of 36 stocks 17 of them increased their dividends while BP is the only stock who cut their dividends to half.


Tuesday, August 11, 2020

Monthly Dividend Update - July 2020

 Monthly Dividend Update - July 2020

    Hello everyone, today I am sharing my updated dividend growth portfolio at the end of July 2020. I always keep track of my investment portfolio in google sheet. It helps me to understand my portfolio performance so that I can make the right decision of my trades and in which direction my portfolio is going. I am not investing to retire early that's why I am investing only 10% of my salary for investing. My main investing strategy is to invest in dividend-paying stocks however, I also invest a very small percent paying stocks such as GOOGL, AMZN, TSLA, FB, etc. I also invest in cryptocurrencies mostly Bitcoin and Ethereum. So monthly, 80% of my investment goes to dividend-paying stocks, 10% in non-dividend paying stocks, and 10% in cryptos. All of my investments are for the long term. I don't sell stocks that often. In July, I did not purchase any stocks. I think there will be a drop in the market soon as the election is coming. So its better to pile up cash. I have received only $38 in dividends. The amount dropped due to the selling of my entire JPMorgan (JPM) stocks. JPM is a great stock to hold for longer time but I am thinking its not a good time to hold bank stocks. This month I have received dividends mostly from PPL Corp (PPL), Coca-Cola (KO), and Legget & Platt (LEG). I am currently doing DRIP to all of my positions except for NAT stocks.


    The following chart shows the dividends received monthly from my portfolio. The chart indicates the growth of my monthly dividends with time. If I keep investing in these stocks, my income will only grow with time.


    The following chart compares my monthly dividends on a yearly basis. In the last month, I have received $38 while in the same month in 2019 I received $48. My income dropped in this part of the quarter because I have sold my positions in JPM, IRM, and MPW stocks.  

    
    The next chart shows the total amount of dividends received on a quarterly basis. My previous two years have seen an increase in dividends every quarter. This year it may decrease as I have sold some stocks such as my bank and REIT positions such as BAC, JPM, MPW, and IRM. The companies have started to report their Q2 earnings and the reports are not quite good. However, the market is continuing its bull run resulting very high PE and Payout Ratios. I am expecting a market correction then I will invest a good amount of money in the market.


    On a yield basis, the current yield of my overall portfolio is 2.94% and my yield on cost (YOC) is 4.04%. The YOC is higher than the current yield because the companies in my portfolio increase their dividend payouts on a yearly basis. So for the longer run, the YOC will only keep going up unless any company cut their dividends. 


    From the following curve, we can see a comparison of the current yield vs. the YOC and it is clear that the YOC is slowly increasing with time.

    The chart below shows the average dividend income received monthly and the average amount of dividends received monthly. I am slowly increasing my passive income and if I continue to invest in the dividend-paying stocks it will only grow with time.

    The chart and table below summarize my dividend distribution in the portfolio. The most percentages of dividends I am receiving are from Abbvie (ABBV), At&t (T), and 3M (MMM). They are the source of almost 30% of my total dividend income. I have to diversify my position that's why I will not add any more stocks into these three companies. 


    The following treemap shows the dividends I am receiving from individual stocks and also compares between the sectors. I am getting the highest amount of dividends from the health sector followed by the industrial sector and consumer cyclical.


    The following table shows the dividends that I received from my positions in each month. This chart is very helpful to track my monthly income through dividends.


    The next table shows the total amount of dividends received in 2020 from my stocks positions. In July I have received $38 and so far in 2020, I have received $617 in dividends.


    The next table shows my dividend growth performance in the year. Out of my 34 stocks 18 of them increased dividends, 4 of them did not raise any dividends, and only BP cut their dividends by half. They raised the dividends in Match however, due to the pandemic they are forced to cut the dividend to half.