Monthly Dividend Update - December 2020
Hey what's up guys. Today I am going to share my updated dividend growth portfolio at the end of December 2020. In December, I have sold my entire position in the tanker company Nordic American Tanker (NAT) and initiated new position in Kimberly Clark (KMB). This is a great company for long term play and definitely a recession proof stock. I am slowly growing my positions in the dividend paying stocks. The ETFs that I am holding are part of my retirement account. In the future I am planning to add a few VOO shares in the retirement portfolio. The table below shows the dividends that I received in December 2020.

The following chart shows the dividends received monthly from my portfolio. The chart indicates the growth of my monthly dividends with time. If I keep investing in these stocks, my income will grow with time. This part of the quarter gives me the highest income. My income from the last quarter dropped because NAT lowered their dividends 80%. They pay dividends cyclically. I have sold all of my positions in NAT.

The following chart compares my monthly dividends on a yearly basis. In the last month, I have received $168.68 while last year in the same month I received around $120.

The next chart shows the total amount of dividends received in each quarter and compares the total amount of dividends with the previous years.

On a yield basis, the current yield of my overall portfolio is 2.53% however my yield on cost (YOC) is 3.84%. The YOC will continue to increase because the dividend paying stocks always increase their dividends yearly so the YOC will only increase with time. On the other hand, the current yield depends on the market. If the market is in bull mode then the yield will drop and it will increase when the market is in bear mode.

The following figure shows the YOC and current yield comparison with time. My YOC is gradually increasing while the current yield fluctuated in the same range which is dependent on the market condition. Currently the market is in bull mode so the current yield is dropping but the YOC is increasing because of the dividend increase from the companies.

The chart below shows the average dividend income received monthly and the average amount of dividends received monthly. I am slowly increasing my passive income and if I continue to invest in the dividend paying stocks it will only grow with time.

The chart and table below summarizes my dividend distribution in the portfolio. The most percentages of dividends I am receiving are Vanguard High Yield (VYM), Abbvie (ABBV), At&t (T), Johnson & Johnson (JNJ) etc. They are the sources of 35% of my total dividend incomes. I have to buy other dividend paying stocks to balance the dividend distribution.
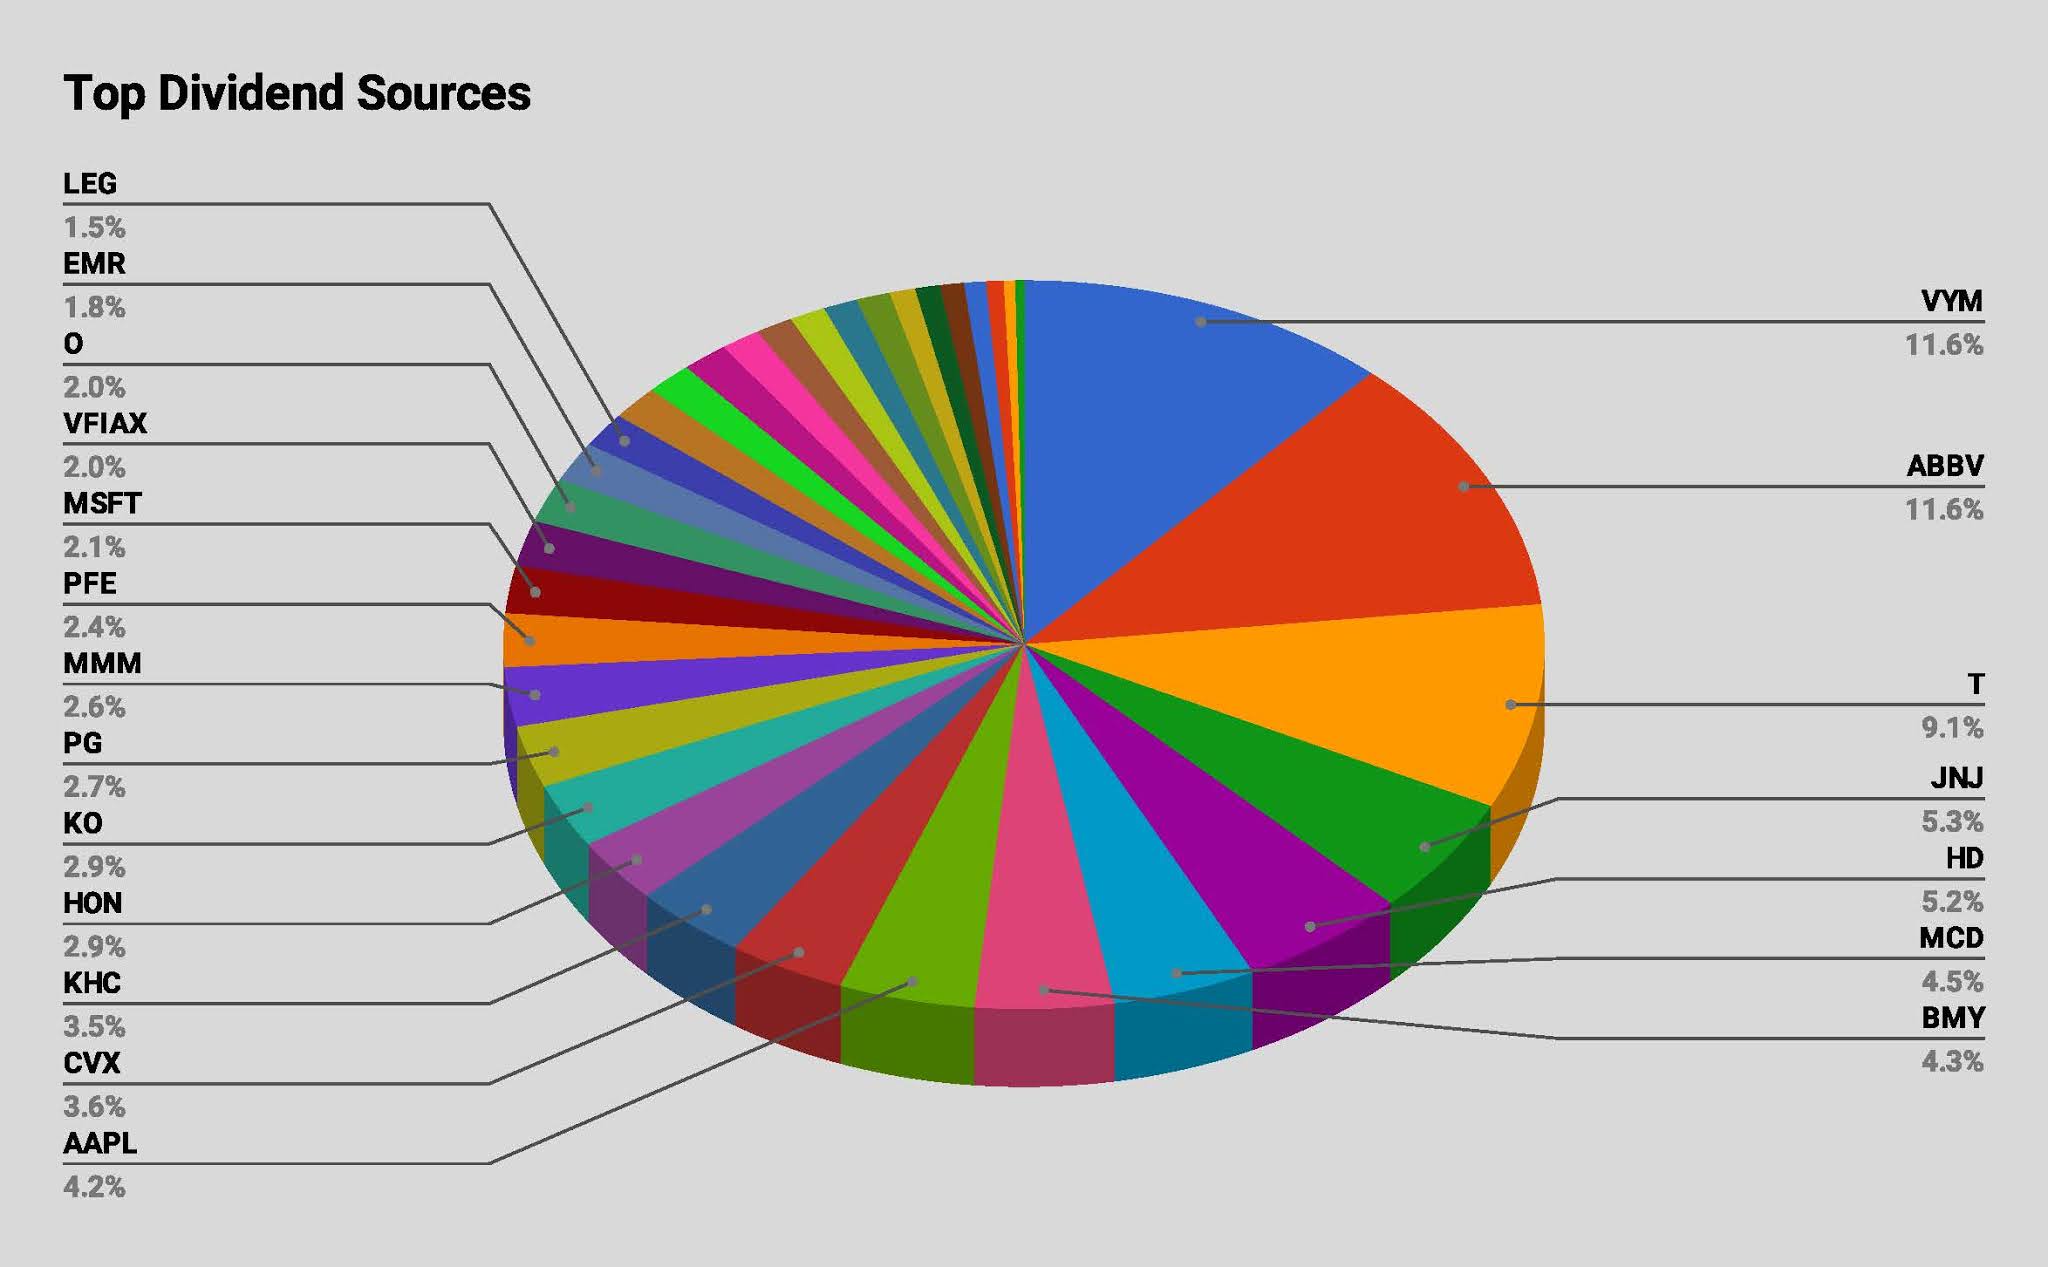
Table:

The following tree map shows the percentage of dividends that I am receiving from the individual stocks and also compares between the sectors. It helps me to understand which sectors are paying me the most in dividends. The map shows that I am getting the highest amount of dividends from the health sectors followed by the ETFs and consumer cyclical.

The following table shows the dividends that I received from my positions in each month. This chart is very helpful to track my monthly income through dividends.

The next table shows the total amount of dividends received in 2020 from my stocks positions. In December 2020, I have received $168.68. In 2020, I have received $1190 in dividends.

The next table shows my dividend growth performance in the year. Out of all of my positions, none of my holdings cut their dividends surprisingly. Only 4 of them did not raise their dividends. Among them At&t and Leggett & Plat did not raise who has good record of increasing dividends.

No comments:
Post a Comment