Monthly Dividend Update - January 2021
Hey guys, today I am sharing with you my dividend status of my portfolio at the end of January 2021. In January, I was very active in buying stocks. I have initiated my positions in General Mills (GIS), Hormel Foods (HRL), and Citi Bank (C). I have also purchased Kimberley Clark (KMB) and PPL Corp (PPL) stocks in my portfolio. I have also purchased Vanguard High Yield (VYM) in my retirement portfolio. As I have written in my previous blogs that I invest 80% in dividend paying stocks, 10% in non-dividend paying stocks, and the rest 10% in the Cryptos. At this current condition, I am not adding any cryptos. I am investing that money into non-dividend paying stocks. The table below shows the dividends that I received in January 2021. This month my income was too little as I sold a good number of stocks to get cash to buy my first home.

The following chart shows the dividends received monthly from my portfolio. The chart indicates the growth of my monthly dividends with time. If I keep investing and hold in these great companies my income will continue to grow with time.
The following chart compares my monthly dividends on a yearly basis. In the last month, I have received only $23 while last year in the same month I received around $60. It dropped significantly because I sold some of my major holdings such as JP Morgan (JPM), Medical Properties (MPW), and PPL Corporation (PPL).
The next chart shows the total amount of dividends received in each quarter and compares the total amount of dividends with the previous years.
On yield basis, the current yield of my overall portfolio is 2.68% however, my yield on cost (YOC) is 3.82%. The YOC will continue to increase because the dividend paying stocks always increase their dividends yearly so the YOC will only increase with time. On the other hand, the current yield depends on the market. If the market is in bull mode then yield will drop and will increase if the market is in bear mode. The later condition will give you buying opportunity.
The following figure shows the YOC and current yield comparison with time. My YOC is gradually increasing with time while the current yield fluctuated in the same range which depends on the market condition. On the other hand the YOC increases with time because most of the companies increase their dividends yearly and it does not fluctuate with the market condition.
The chart below shows the average dividend income received monthly and the average amount of dividends received monthly. I am slowly increasing my passive income and if I continue to invest in the dividend paying stocks it will only grow with time.
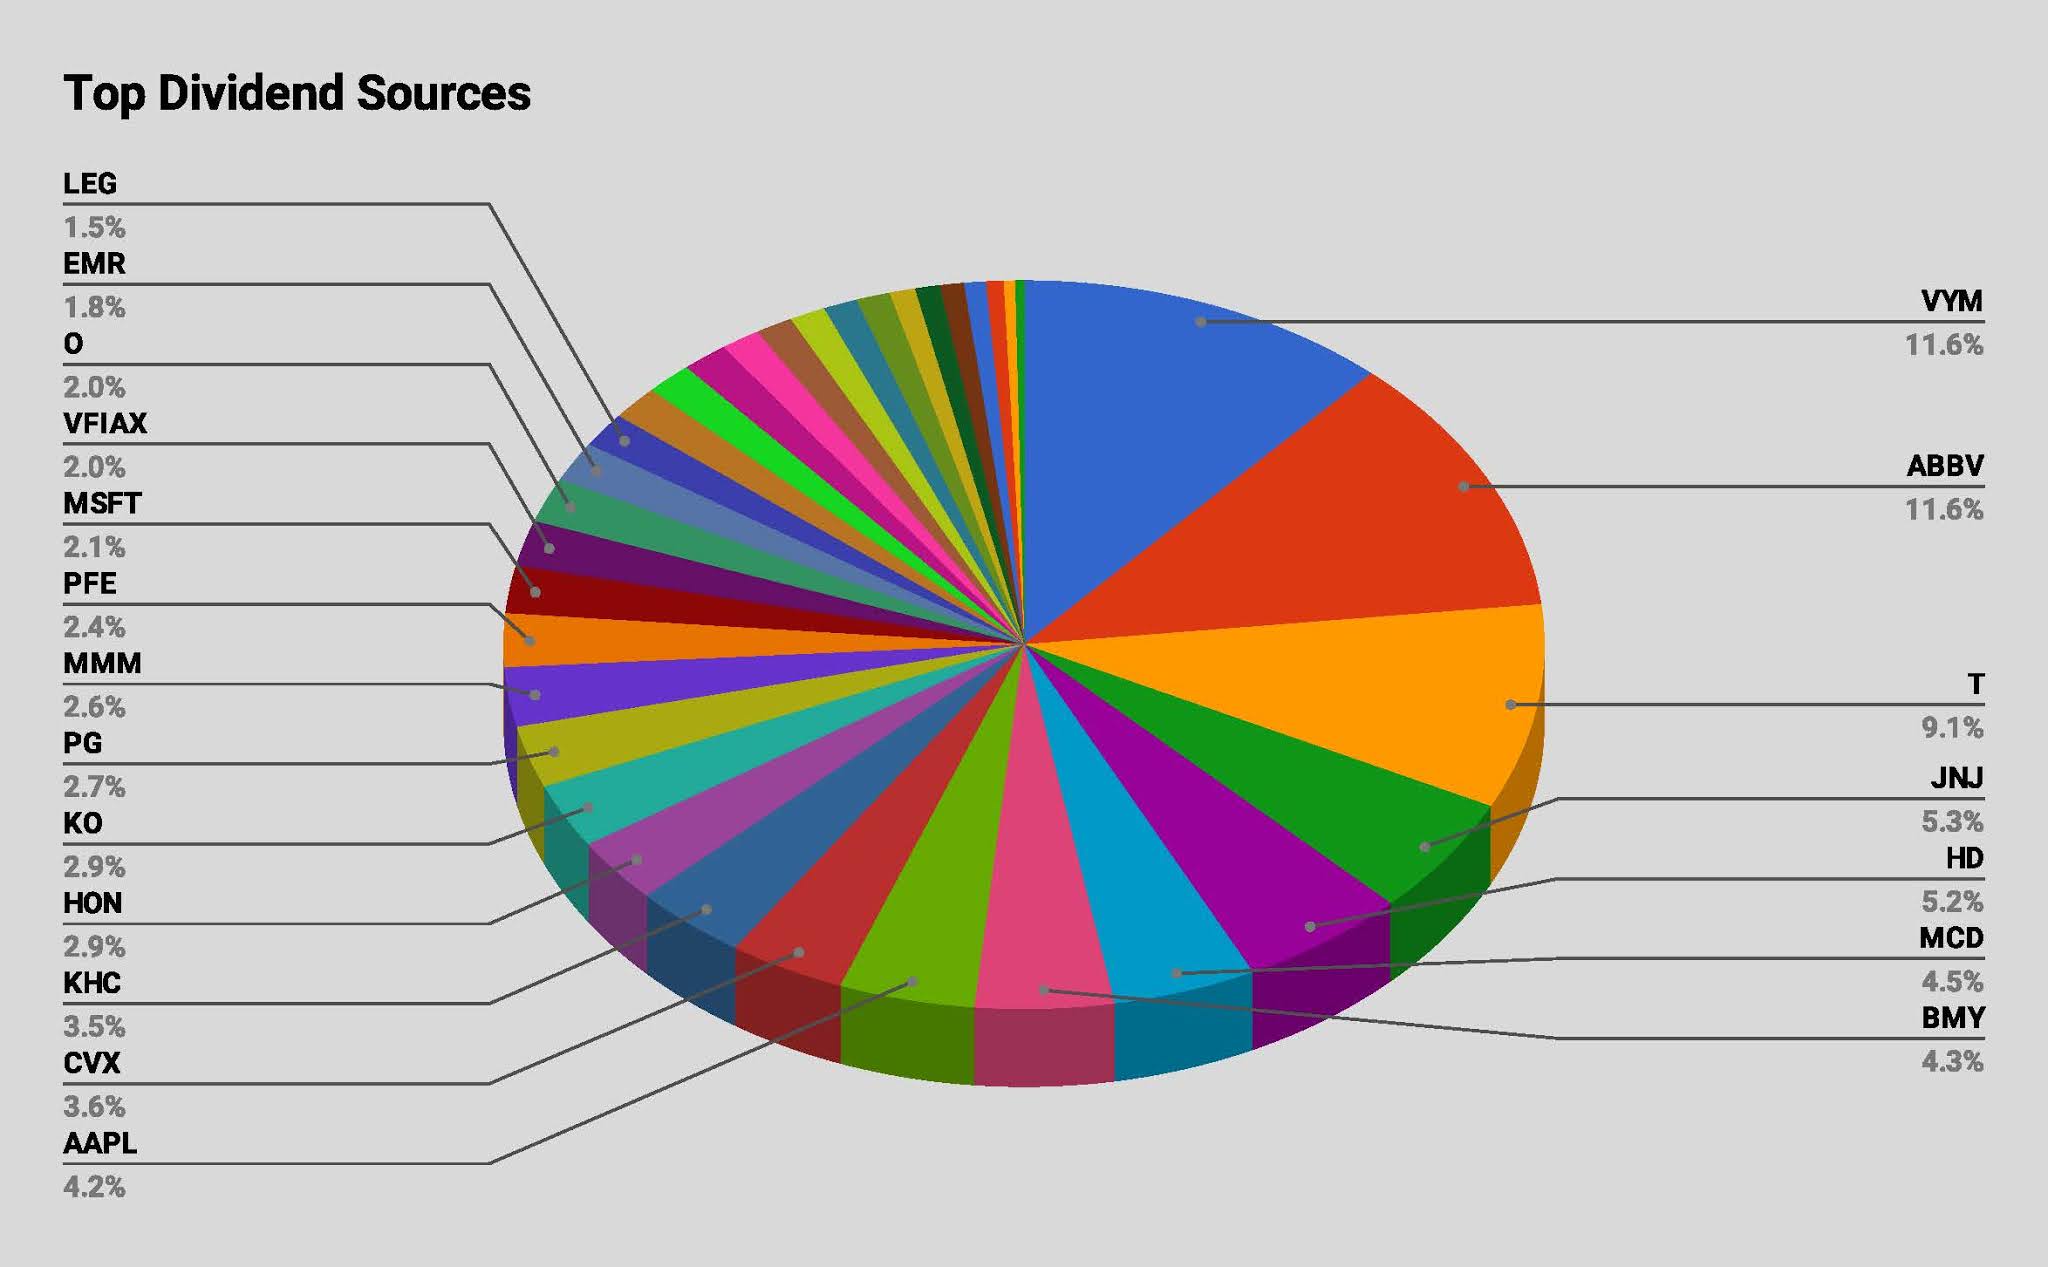
The chart and the table below summarizes my dividend distribution in the portfolio. The most percentages of dividends I am receiving are from the Vanguard High Yield (VYM), Abbvie (ABBV), At&t (T), Johnson & Johnson (JNJ), and Home Depot (HD) etc. They are the 40% of my total dividend incomes.
Dividend Source in the table format:
The following tree map shows the percentage of dividends that I am receiving from the individual stocks and also compares between the sectors. It helps me to understand which sectors are paying me the most in dividends. The map shows that I am getting the highest amount of dividends from the health sectors followed by the consumer defensive, ETFs and consumer cyclical.
The following table shows the dividends that I received from my positions in each month. This chart is very helpful to track my monthly income through dividends.
The next table shows the total amount of dividends received so far in 2021. In January, I have received a small amount of dividends but in the next cycle I will receive more dividends because I invested in KMB and PPL.
The next table shows my dividend growth performance in the year 2021. Last year, none of my holdings cut their dividends. Only 4 of them did not raise their dividends other than that all of them raised dividends.