April 2020 - Monthly Dividend Update
Hello everyone, today I am sharing my updated dividend growth portfolio at the end of April. I always keep track of my investing portfolio in google sheet. It helps me to understand my portfolio performance so that I can make the right decision of my trades. Using the spreadsheets, I will always be updated of my investments past performance. I am saving 10% of my monthly salary for investing. I invest 80% of that salary to dividend growth stocks, 10% to non-dividend paying stocks such as Google, Amazon, Facebook, Tesla etc. The rest 10% I invest in cryptos mainly Bitcoin and Ethereum. This part of the quarter is the lowest income in dividends compared to the other months. I have trimmed my position in Jp Morgan Chase (JPM) in April. That is the reason my income in this part of the quarter dropped.
The following chart shows the dividends receievd monthly from my portfolio. The chart indicates the growth of my monthly dividends with time. If I keep investing to these stocks, my income will only grow with time.
 |
Monthly dividends received since June 2017
|
The following chart compares my monthly dividends on a yearly basis. In the last month, I have received $54.36 while in the same month in 2019 I received $75 which is a sharp drop compared to the last year. I have sold some high yield dividend paying stocks that I was owning at this time last year. I have sold all of my positions in AGNC and NLY. They were paying high yields and I have decided to sell all of them.
 |
Comparison of Monthly dividends received in each year
|
The next chart shows the total amount of dividends received on a quarterly basis. My previous two years had seen an increase in dividends every quarter. this year I am not so sure. Some of my holdings may cut their dividends partially and completely. So this year is going to show a lots of uncertainty. In Q1, I have seen a 24% YOY increase on a quarterly basis. However, in Q2 my income will drop because I have sold bank and energy stocks and also some of my holdings may cut dividends.
 |
Dividend Income on a Quarterly Basis
|
On a yield basis, the current yield of my overall portfolio is 3.11% while my yield on cost (YOC) is 3.82%. My YOC dropped a little because I have sold my entire position in BP and partially in JPM.
 |
| YOC vs. current yield with time |
The chart below shows the average dividend income received monthly and the average amount of dividends received monthly. I am slowly increasing my passive income and if I continue to invest in the dividends-paying stocks it will only grow with time.
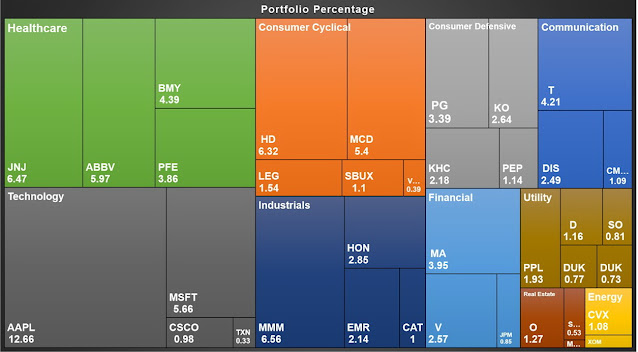
The chart and table below summarize my dividend distribution in the portfolio. The most percetages of dividends I am receiving are from Abbvie (ABBV), At&t(T), and 3M (MMM). They are covering almost 30% of my total dividend income. I have to diversify my positions that's why I will not add any more stocks from these 3 companies. I will look to add more stocks of Home Depot(HD) and Johnson & johnson (JNJ).
The following tree map shows the dividends I am receiving from individual stocks and also compares between the sectors. I am getting the highest amount of dividends from the healthsector followed by the industrial sector and consumer cyclical.
The following table shows the dividends that I received from my positions in each month. This chart is very helpful to track my monthly income through dividends.
The next table shows the total amount of dividends received in 2020 from my stock positions. In April, I have received $54 and this chart will also help me to keep a record of my yearly income.
The next table shows my dividend growth performance in 2020. Out of my 36 stocks, 20 of them already increased their dividends this year while only 1 stocks (Volkswagen) suspended their dividends and The Kraft and Heinz (KHC) and Exxon Mobil (XOM) did not raise the dividends but maintaining the same amount of dividends. I cannot tell if all the companies will be able to keep their dividends safe. Last month Apple (AAPL) and Johnson and Johnson (JNJ) increased 6.5% and 6.3% dividends respectively.