Portfolio Update - April 2020

The following pie chart shows the same distribution and currently AAPL is my maximum holding followed by MMM, JNJ, and ABBV. In future I will slowly add JNJ, HD, and MSFT.

The sector distribution of my portfolio is shown in the following pie chart. The sectors are based on Yahoo Finance. Currently, my highest position is in the health sector followed by technology and consumer cyclical.

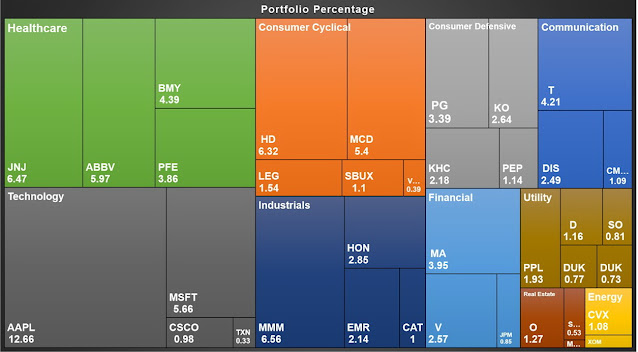
The following tree map shows the sector distributions and the stocks under each stocks.
I always update my transaction in the tipranks website and the figure below compares my portfolio performance against the S&P 500. In most of the cases my portfolio beat the market.

The following table shows my growth of my portfolio since 2017 and the comparison with the Vanguard 500 Index. I plotted this figure from portfoliovisualizer. I am slightly beating the index.
 |
| from portfoliovisualizer. |

My 12 month returns (TTM) is 3.88% while the YTD return is -6.58% which is due to the volatility of the market. I am investing for longer term so I am not worried of this downturn. This is actually good time for me to invest.

The table below shows the dividends that I received in April 2020. I have done DRIP of all the dividends that I received.

The following table shows the detailed performances of my portfolio. The current prices are based on April 30, 2020. In the chart, I have shared my current positions, annual income through dividends, total received dividends from each companies so far, cost basis, YOC, current yield, and finally the total gain or loss including the dividend income. My biggest gains so far is from MSFT then MA, V

The following treemap shows my gains in every sector under each stock. I have a huge gain in the tech sectors followed by financial and consumer defensive.

Congrats on a solid month. This is my first time here. I love your charts. In April I only earned $0.33 in dividends. I'm starting over with dividend investing, so I have a long way to go. I look forward to seeing how much dividends you will receive in May.
ReplyDeleteThanks for your time in my blog. I am growing slowly. I entered lately. So I have less scope to pour money into stocks.
DeleteHey! Looks like a solid month report with those divvy increases, inspiring stuff – keep it up man. Now is a difficult time, and I hope that there will be no loss!
ReplyDeleteThanks man. This market is now scary for me. I am holding cash right now. No one knows how the market will in the next few months.
Delete