Monthly Dividend Update - November 2020
Hello everyone, today I am sharing my updated dividend growth portfolio at the end of November 2020. Last two months I did not update my portfolio because I was busy of buying my first home. I could not resist myself of buying my first ever home with a very low interest rate. Additionally, I had to sell some of my stocks to cover my closing costs and other expenses. I got a loan with 2.87% fixed rate interest conventional loan. I have sold all of my positions to PPL and a major portion of Pfizer (PFE) and 3M (MMM) back in October. All of my investments are for the longer term but this time I had to sell the positions. As I have mentioned in my previous blogs, I invest 10% of my salary in every month. Out of that money, 80% goes to dividend paying stocks, 10% in non-dividend paying stocks, and 10% in the cryptos. In the last two months I only bought At&t (T) stocks when it was really cheap. I bought them around $27. In my retirement accounts I have added a few Vanguard High Yield (VYM). The table below shows the dividends that I received in November 2020

The following chart shows the dividends received monthly from my portfolio. The chart indicates the growth of my monthly dividends with time. If I keep investing in these stocks, my income will grow with time.

The following chart compares my monthly dividends on a yearly basis. In the last month, I have received $87 while last year in the same month I received $89. I have sold some stocks in this year, that's why the earnings dropped a little bit.

The next chart shows the total amount of dividends received in each quarter and compares the total amount of dividends with the previous years.

On a yield basis, the current yield of my overall portfolio is 2.73% while my Yield on Cost (YOC) is 4.05%. The YOC will continue to increase because the dividend paying stocks always increase their dividends yearly so the YOC will only increase with time. On the other hand, the current yield depends on the market. If the market is in bull mode then the yield will drop and it will increase when the market is in bear mode.

The following figure shows the YOC and current yield comparison with time. My YOC is gradually increasing while the current yield fluctuated in the same range which is dependent on the market condition.

The chart below shows the average dividend income received monthly and the average amount of dividends received monthly. I am slowly increasing my passive income and if I continue to invest in the dividend paying stocks it will only grow with time.

The chart and table below summarizes my dividend distribution in the portfolio. The most percentages of dividends I am receiving are from Abbvie (ABBV), Vanguard high yield (VYM), and At&t (T). They are the source of more than 30% of my total dividends.


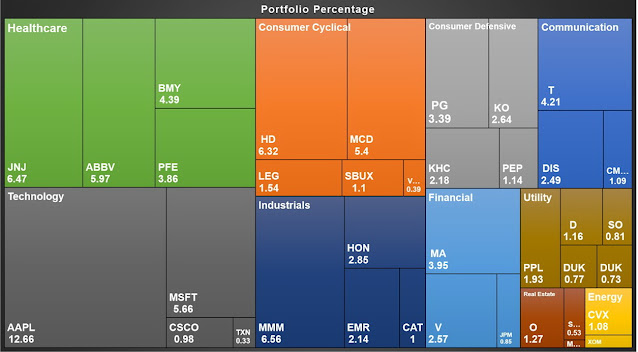
The following tree map shows the percentage of dividends that I am receiving from the individual stocks and also compares between the sectors. It helps me to understand which sectors are paying me the most in dividends. The map shows that I am getting the highest amount of dividends from the health sectors followed by the industrial sectors.

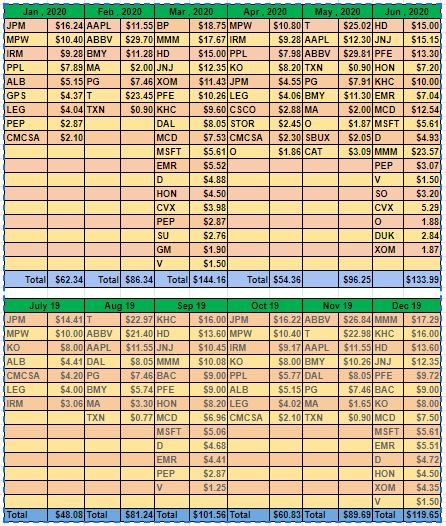
The following table shows the dividends that I received from my positions in each month. This chart is very helpful to track my monthly income through dividends.

The next table shows the total amount of dividends received in 2020 from my stocks positions. In November 2020, I have received $87. So far in 2020, I have received $1022 in dividends.

The next table shows my dividend growth performance in the year. Out of all of my positions, none of my holdings cut their dividends. Only 4 of them kept the dividends same otherwise all of them increased their dividends in 2020.