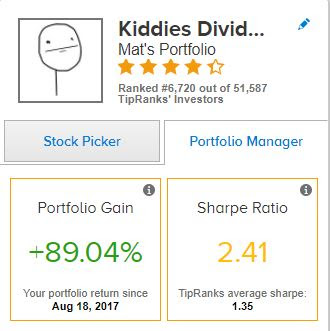
I always keep track my portfolio on the Tipranks website and the figures below compares my portfolio with the S&P 500 in the last 12 years. In the recent months my portfolio is performing similar to S&P 500.
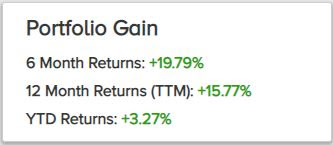
My 12 months return (TTM) is 15.77% and the last 6 month return was 19.79%. All of my investments are for a longer term. So it will only grow with time.
The table below shows the dividends that I received in December 2020. I have done DRIP of all the dividends that I received. I have received $168.68 in dividends in the last month.
The following table shows the detailed performance of my portfolio. The current price in the table is based on the price on December 31st 2020. In the table, I have shared my current positions, annual income through dividends, total received dividends from each company so far, cost basis, YOC, current yield, and finally the total gain or loss including the dividend income. My top 5 performers based on gain so far are AAPL (218%), MSFT (168%), MA (141%), STOR (102%), and V (100%). The only stock that I am in loss is CVX (-2.9%). However, if I look for long term then energy sector has good potential to move up.
The following treemap shows my gains in every sector under each stock. I have a huge gain in the tech and financial sectors. In tech I am gaining in Apple (AAPL) and Microsoft (MSFT). In the consumer sector I am gaining mostly from Starbux (SBUX), in the financial sector Mastercard (MA) and Visa (V), in the industrial sector its Caterpiller (CAT), in Procter & gamble (PG) in the consumer defensive sector, Store Capital (STOR) in the REITs, and in the health sector I am gaining mostly in Abbvie (ABBV) and Bristol Myers Squib (BMY).


