Monday, March 29, 2021

How much money I am getting from my Dividend Stocks portfolio

 Portfolio Update - February 2021    


Hey guys, today I am going to share with you how much money I am getting from my dividend investment portfolio. I maintain three different portfolios. The 80% of my investment goes to this portfolio. Other 10% goes to aggressive investment like TQQQ, QLD, UPRO, and ARK funds. The rest 10% goes to crypto. I have sold 50% of my crypto holdings and took some mind-blowing profit. Now comes the headache of estimated tax filing for quarter 1. Ok lets dig into my dividend stock portfolio. In this portfolio I invest into stocks which has record of paying dividends and increase the dividend rate every year. Investing in dividend paying stocks are sometimes boring but it helps to grow your wealth gradually. By investing in more dividend stock your income will increase in two different ways. Investing in dividend stocks will increase your income and the second source of increase is the dividend rate increase. The dividend stocks in my portfolio increase their dividends on average 4% per year. So if you think about longer term with a larger investment this increase every year will boost your income significantly. By following this rule, Warren Buffett is earning $3.8 billion per year in dividends according to NASDAQ website. Now lets jump into the stocks in my portfolio:


I own 41 stocks in my portfolio where AAPL is my highest position followed by Vanguard High Yield (VYM), Abbvie (ABBV), Home Depot (HD), etc. The top 10 holdings in my portfolio represents 54% of my portfolio. The following pie chart also shows my portfolio.


 I diversify my portfolio by investing in different sectors. Warren Buffett famously said that "Don't put all your eggs in the same basket". If the basket falls then all of your eggs will be broken. You have to put eggs in different baskets so that if one basket fells other eggs will not be broken. Its very important to diversify your portfolio in different sectors. The following pie chart shows the sector distribution of my portfolio.


The sectors are selected based on yahoo finance. My highest position is in the tech sector (19.4%) followed by the healthcare (15.7%), consumer defensive (15.6%), ETFs (14%) etc.

The following tree map shows the stocks that I am holding the most under each sector. I really like tree maps as it gives me more in depth about my portfolio. 


For example, the previous pie chart was showing that my highest holdings are in the tech sector but it was not showing which stocks I am holding the most under the tech sector. The tree map shows that my highest position is in the tech sector and AAPL is the highest position in the sector followed by MSFT and CSCO.

The table below shows the dividends that I have received in February 2021. I have received $104.62 in dividends mostly from ABBV, T, AAPL, and BMY. 


On average I am currently earning $119 per month in dividends totaling $1479 per year. If I continue to invest regularly then it will keep growing and the companies will keep increasing dividends every year. This will compound the income and after few years I will start to see snowball effect. This is the magic of investing in dividends paying stocks.


The following table shows the detailed performance of my portfolio. The current price in the table is based on the price on February 28th 2021. In the table, I have shared my current positions, annual income through dividends, total received dividends from each company's far, cost basis, YOC, current yield, and finally gain or loss with including the income from dividends. My top 5 performers are AAPL (190%), Microsoft (179%), MasterCard (140%), Caterpillar (122%), and Starbux (100%). 


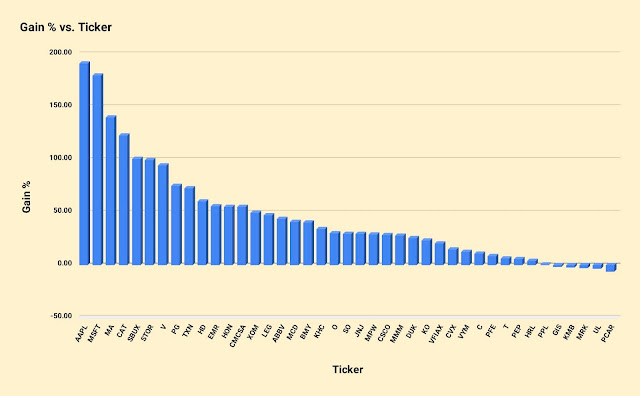
The chart below shows the gain vs. tickers. The stocks that I am losing are mostly new investments. The least growth stocks that I am holding for long time is At&t (T) and Ppl (PPL). 


The following tree-map shows my gains in stocks under each sector. I have a huge gain in the tech although the techs are down a bit at the recent times. In the tech my highest gains are from AAPL and MSFT, in the industrial sector the highest gain is from Caterpillar, in financial sector its Mastercard, in the consumer cyclical SBUX, In the consumer defensive Procter & Gamble, In the Healthcare its ABBV, in the energy sector its Exxon Mobil, and in the real estate its Store capital.


Friday, March 12, 2021

Monthly Dividend Update - February 2021

 Monthly Dividend Update - February 2021


Hey Guys, today I am going to share my dividend status of my portfolio. I am maintaining three different portfolios. The other portfolios are based on aggressive growth portfolio which has much higher risk but will have chance to get much higher return and the last portfolio is for the cryptos. 80% of these investment goes to my dividend portfolio and the 10% for the aggressive growth and crypto portfolio. In February, I have added PepsiCo ($PEP) $PPL, Merck ($MRK), and Unilever (UL) in my dividend portfolio. In my retirement account I have added Vanguard High Yield ($VYM). The table below shows the dividends that I have received in February 2021. This month my major incomes are from ABBV and T. I have also earned from AAPL and BMY.


The following chart shows the dividends received monthly from my portfolio. The chart indicates the growth of my monthly dividends with time. If I keep investing and hold in these great companies, my income will continue to grow with time.


The following chart compares my monthly dividends on a yearly basis. In the last month, I have received $104.62. Last year, I received around $80 in the same month. 


The next chart shows the total amount of dividends that I have received quarterly. My income is gradually increasing in every year.

On yield basis, the current yield of my overall portfolio is 2.72% however, my yield on cost (YOC) is 3.77%. The YOC will continue to increase because the dividend paying stocks always increase their dividends yearly so the YOC will only increase with time. On the other hand, the current yield depends on the market. If the market is in bull mode then yield will drop but will increase if the market is in bear mode. The later condition means its a buying market. That's why I always hold cash to utilize the opportunity.


The following figure shows the YOC and current yield comparison with time. My YOC is gradually increasing with time while the current yield fluctuated in the same range which depends on the market condition. On the other hand the YOC increases with time because most of the companies increase their dividends yearly and it does not fluctuate with the market condition.


The chart below shows the average dividend income received monthly and the average amount of dividends received monthly. This chart helps me to understand my monthly dividends and total yearly projected dividends. I am slowly investing in dividend paying stocks and if I continue to do like this income will continue to grow. 


The chart and the table below summarizes my dividend distribution in the portfolio. The most percentages of dividends I am receiving are from the Vanguard High Yield (VYM), AbbVie (ABBV), At&t (T), and Kimberly Clark (KMB). They are 35% of my total dividends that I receive yearly. 


Dividend sources in the table format:


The following tree-map shows the percentages of dividends that I am receiving from the individual stocks and also compares between the sectors. it help me to understand which sectors are paying me the most in dividends. The map shows that I am getting the highest amount of dividends from the health sectors followed by consumer defensive, ETFs, and consumer cyclical. 


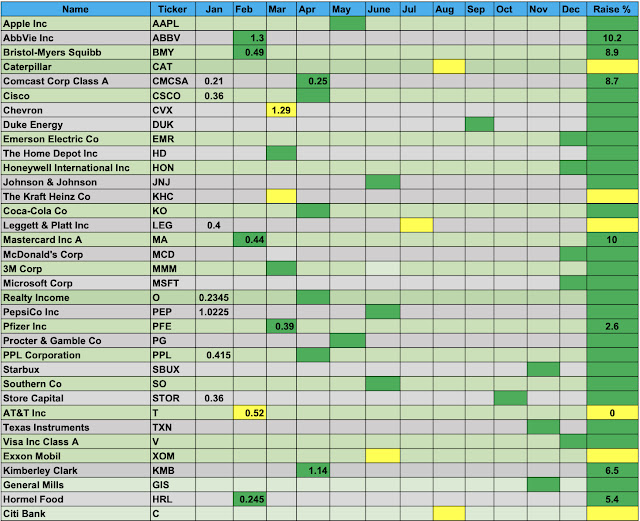
The following table shows the dividends that I received from my positions in each month. This chart is very helpful to track my monthly income through dividends. 


The next table shows the total amount of dividends received so far in 2021. In February, I have received $104 which is the highest so far in this part of the quarter.


The next table shows my dividend growth performance in the year 2021. last year, none of my holdings cut their dividends. 


Sunday, February 14, 2021

Stocks that will give you peace in your retirement

  Portfolio Update - January 2021


Today I am going to share the status of my portfolio at the end of January 2021. My plan is to gradually invest in the stocks that pay dividends and increase the dividends in every year. Investing in dividend stocks is kind of boring but it will help your wealth grow effectively with time with less risk compared to non-dividend paying stocks. They perform good when the market foes to bear mode. Because I am young so I have decide to invest 20% of my invest into aggressive stocks and in the cryptos. I invest a small portion in non-dividend paying stocks like Amazon (AMZN), Google (GOOG), Tesla (TSLA) etc. I also invest a small percentage in the cryptos. I mostly invest in Bitcoin and Ehteruem. Other notable cryptos that I am invested in is Binance Coin (BNB), Chainlink (LINK), Crypto.com (CRO), and VeChain (VET). Recently I have sold some of the cryptos to take profit. Currently I am only buying USDC. These risky positions will help me to build my wealth faster than the dividend paying stocks considering my age. When I will be close to my retirement I can sell these positions and will be able to buy a lot of dividend paying stocks for the retirement income. The table below shows my current portfolio distribution:


The following pie chart also shows my portfolio and you can see that currently Apple (AAPL) is my largest holding followed by Vanguard High Yield (VYM), The Home Depot (HD). The two ETFs that I am holding they are actually from my retirement fund. 


The sector distribution of my portfolio is shown in the following pie chart. I have selected the sectors based on Yahoo Finance. Currently my highest percentage of portfolio are in the tech sector as they are performing superbly for the last few years. My next two largest holdings are in the healthcare and ETFs. 


The following tree-map shows the sectors that I am holding the most and also the shares under each sector. I like the tree-maps as it helps to understand the portfolio much better. I am holding the most in the tech sector followed by the healthcare.


I also keep updated my portfolio in TipRanks where I can track my overall gain of my capital since I started to invest in 2017. So far my capital gain is 84.89% and my Sharpe ratio is 2.28. I am ranked among the top 15% of the total investor in the website.


My 12 month return (TTM) is 13.29% and the last 6 months return is 11.99%. I am investing for longer term. I have no intention to sell them unless if I need for any emergency.


The table below shows the dividends that I have received in January 2021. I have received only $23 because I have sold a good number of stocks to purchase my first home. However, I have purchased KMB, MRK, and PPL recently. So my income at this period of the quarter will increase. 


On average I am currently earning around $110 monthly in dividends totaling $1329 a year. If I continue to invest regularly then it will keep growing and the companies will keep increasing their dividends every year. This will compound the income and after few years I will start to see snowball effect. This is the magic of investing in dividend paying stocks.


The following table shows the detailed performance of my portfolio. The current price in the table is based on the price on January 31st 2021. In the table, I have shared my current positions, annual income through dividends, total received dividends from each company so far, cost basis, YOC, current yield, and finally the total gain or loss including the dividend income. My top 5 performers in terms of gain are AAPL (216%), MSFT (179%), MA (114%), CAT (86%), and STOR (85%). I am only loosing in CVX (-1.84%) and recently purchased C (-3.37%). The total gain of my current holdings are 48%. 


The following tree-map shows my gains in every sector under each stock. I have a huge gain in the tech, consumer, industrial, and financial sectors. In the tech I have big gain in AAPL and MSFT. In the consumer sector I have gain mostly in SBUX and HD. In the industrial sector I have big gain in CAT stock. I am also gaining a lot in MA, V, STOR, and PG.


Saturday, February 6, 2021

Monthly Dividend Update - January 2021

 Monthly Dividend Update - January 2021


Hey guys, today I am sharing with you my dividend status of my portfolio at the end of January 2021. In January, I was very active in buying stocks. I have initiated my positions in General Mills (GIS), Hormel Foods (HRL), and Citi Bank (C). I have also purchased Kimberley Clark (KMB) and PPL Corp (PPL) stocks in my portfolio. I have also purchased Vanguard High Yield (VYM) in my retirement portfolio. As I have written in my previous blogs that I invest 80% in dividend paying stocks, 10% in non-dividend paying stocks, and the rest 10% in the Cryptos. At this current condition, I am not adding any cryptos. I am investing that money into non-dividend paying stocks. The table below shows the dividends that I received in January 2021. This month my income was too little as I sold a good number of stocks to get cash to buy my first home. 


The following chart shows the dividends received monthly from my portfolio. The chart indicates the growth of my monthly dividends with time. If I keep investing and hold in these great companies my income will continue to grow with time. 


The following chart compares my monthly dividends on a yearly basis. In the last month, I have received only $23 while last year in the same month I received around $60. It dropped significantly because I sold some of my major holdings such as JP Morgan (JPM), Medical Properties (MPW), and PPL Corporation (PPL).


The next chart shows the total amount of dividends received in each quarter and compares the total amount of dividends with the previous years.


On yield basis, the current yield of my overall portfolio is 2.68% however, my yield on cost (YOC) is 3.82%. The YOC will continue to increase because the dividend paying stocks always increase their dividends yearly so the YOC will only increase with time. On the other hand, the current yield depends on the market. If the market is in bull mode then yield will drop and will increase if the market is in bear mode. The later condition will give you buying opportunity.


The following figure shows the YOC and current yield comparison with time. My YOC is gradually increasing with time while the current yield fluctuated in the same range which depends on the market condition. On the other hand the YOC increases with time because most of the companies increase their dividends yearly and it does not fluctuate with the market condition.


The chart below shows the average dividend income received monthly and the average amount of dividends received monthly. I am slowly increasing my passive income and if I continue to invest in the dividend paying stocks it will only grow with time.


The chart and the table below summarizes my dividend distribution in the portfolio. The most percentages of dividends I am receiving are from the Vanguard High Yield (VYM), Abbvie (ABBV), At&t (T), Johnson & Johnson (JNJ), and Home Depot (HD) etc. They are the 40% of my total dividend incomes. 


Dividend Source in the table format:


The following tree map shows the percentage of dividends that I am receiving from the individual stocks and also compares between the sectors. It helps me to understand which sectors are paying me the most in dividends. The map shows that I am getting the highest amount of dividends from the health sectors followed by the consumer defensive, ETFs and consumer cyclical.


The following table shows the dividends that I received from my positions in each month. This chart is very helpful to track my monthly income through dividends.


The next table shows the total amount of dividends received so far in 2021. In January, I have received a small amount of dividends but in the next cycle I will receive more dividends because I invested in KMB and PPL.


The next table shows my dividend growth performance in the year 2021. Last year, none of my holdings cut their dividends. Only 4 of them did not raise their dividends other than that all of them raised dividends. 


Sunday, January 17, 2021

Stocks that will generate passive incomes - Portfolio update December 2020

Portfolio Update - December 2020

   
Today I am going to share the status of my portfolio at the end of December 2020. I invest in dividend paying stocks mostly, however I also invest a small portion in non-dividend paying stocks like Amazon (AMZN), Google (GOOG), Facebook (FB) etc. I also invest in cryptos but not at this price. I am selling to take a huge profit. I will use those money to buy stocks. The following table shows my current portfolio distribution:

The following pie chart also shows my portfolio and you can see that currently Apple (AAPL) is my largest holdings followed by the Vanguard High Yield (VYM), and Abbvie (ABBV). I added AAPL in 2018 and after that the price skyrocketed. That is why it is my largest holdings. VYM is part of my retirement fund. 

 
The sector distribution of my portfolio is shown in the following pie chart. I have selected the sectors based on Yahoo Finance. Currently my highest position is in the tech sector followed by the healthcare, and consumer cyclical. In the tech sector, the prices of AAPL, MSFT, and TXN rose sharply that's why percentage in the tech sector on the top.


The following treemap shows the sectors that I am holding the most and also the shares under each sector. I like the tree maps. It helps to understand the portfolio much better. I am holding the most in the tech sector followed by the healthcare.

I always keep track my portfolio on the Tipranks website and the figures below compares my portfolio with the S&P 500 in the last 12 years. In the recent months my portfolio is performing similar to S&P 500.


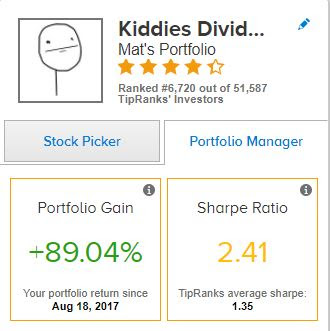
My performance as a portfolio manager is also impressive. At the end of December 2020, I was ranked 6,720 out of 51,587 investors in tip ranks which is at the top 13%. My portfolio has gained 89% since 2017. My sharpe ratio is 2.41 while the average ratio is 1.35.

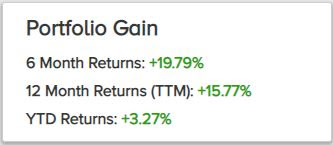
My 12 months return (TTM) is 15.77% and the last 6 month return was 19.79%. All of my investments are for a longer term. So it will only grow with time.

The table below shows the dividends that I received in December 2020. I have done DRIP of all the dividends that I received. I have received $168.68 in dividends in the last month.

    The following table shows the detailed performance of my portfolio. The current price in the table is based on the price on December 31st 2020. In the table, I have shared my current positions, annual income through dividends, total received dividends from each company so far, cost basis, YOC, current yield, and finally the total gain or loss including the dividend income. My top 5 performers based on gain so far are AAPL (218%), MSFT (168%), MA (141%), STOR (102%), and V (100%). The only stock that I am in loss is CVX (-2.9%). However, if I look for long term then energy sector has good potential to move up.


    The following treemap shows my gains in every sector under each stock. I have a huge gain in the tech and financial sectors. In tech I am gaining in Apple (AAPL) and Microsoft (MSFT). In the consumer sector I am gaining mostly from Starbux (SBUX), in the financial sector Mastercard (MA) and Visa (V), in the industrial sector its Caterpiller (CAT), in Procter & gamble (PG) in the consumer defensive sector, Store Capital (STOR) in the REITs, and in the health sector I am gaining mostly in Abbvie (ABBV) and Bristol Myers Squib (BMY).