Monthly Dividend Update - February 2021
Hey Guys, today I am going to share my dividend status of my portfolio. I am maintaining three different portfolios. The other portfolios are based on aggressive growth portfolio which has much higher risk but will have chance to get much higher return and the last portfolio is for the cryptos. 80% of these investment goes to my dividend portfolio and the 10% for the aggressive growth and crypto portfolio. In February, I have added PepsiCo ($PEP) $PPL, Merck ($MRK), and Unilever (UL) in my dividend portfolio. In my retirement account I have added Vanguard High Yield ($VYM). The table below shows the dividends that I have received in February 2021. This month my major incomes are from ABBV and T. I have also earned from AAPL and BMY.

The following chart shows the dividends received monthly from my portfolio. The chart indicates the growth of my monthly dividends with time. If I keep investing and hold in these great companies, my income will continue to grow with time.

The following chart compares my monthly dividends on a yearly basis. In the last month, I have received $104.62. Last year, I received around $80 in the same month.

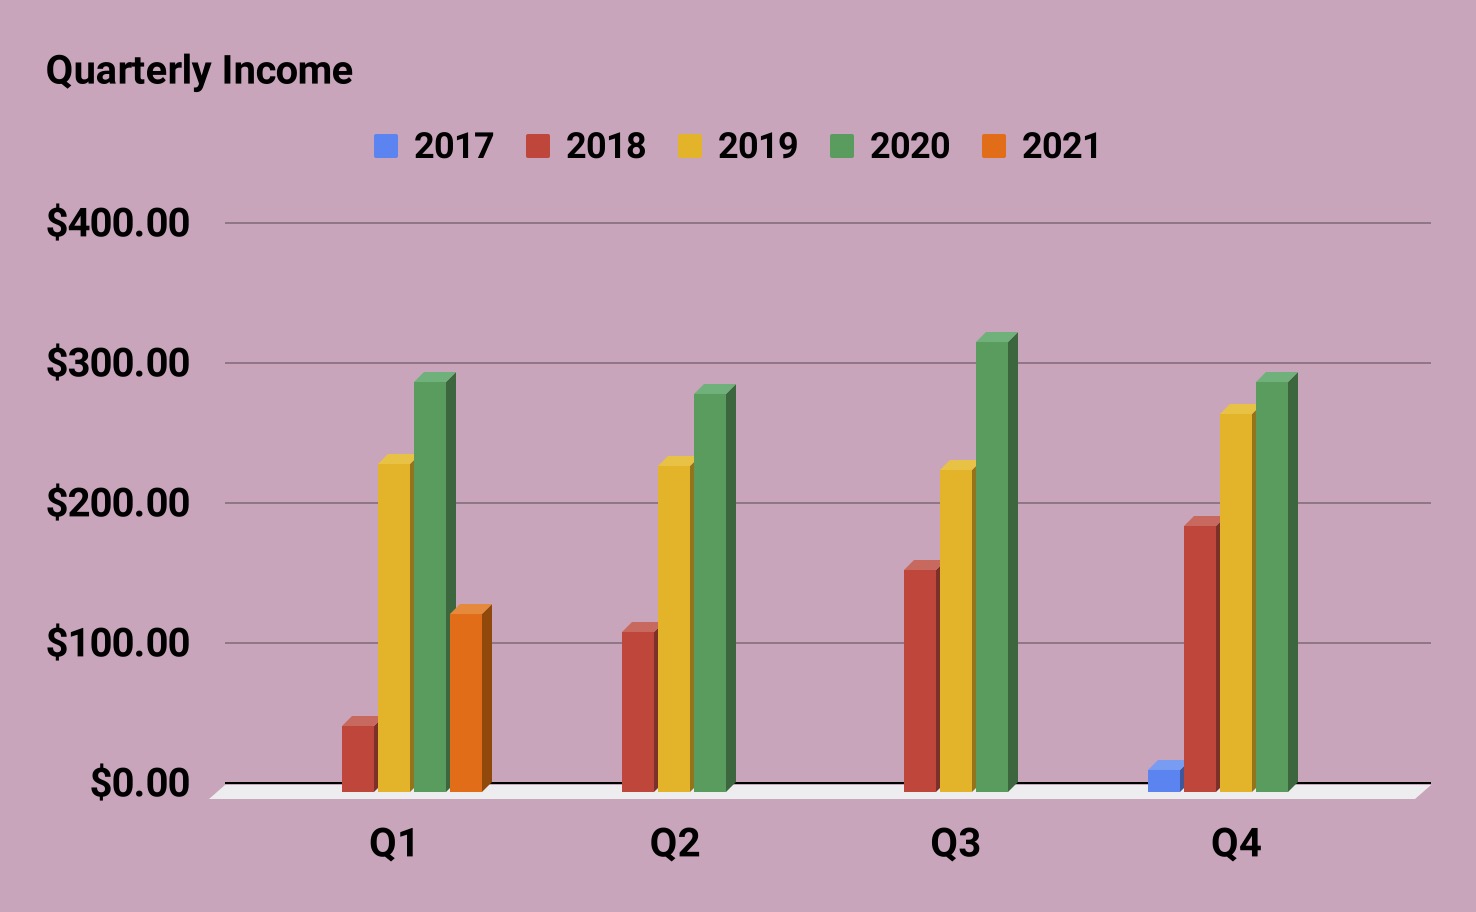
The next chart shows the total amount of dividends that I have received quarterly. My income is gradually increasing in every year.
On yield basis, the current yield of my overall portfolio is 2.72% however, my yield on cost (YOC) is 3.77%. The YOC will continue to increase because the dividend paying stocks always increase their dividends yearly so the YOC will only increase with time. On the other hand, the current yield depends on the market. If the market is in bull mode then yield will drop but will increase if the market is in bear mode. The later condition means its a buying market. That's why I always hold cash to utilize the opportunity.

The following figure shows the YOC and current yield comparison with time. My YOC is gradually increasing with time while the current yield fluctuated in the same range which depends on the market condition. On the other hand the YOC increases with time because most of the companies increase their dividends yearly and it does not fluctuate with the market condition.

The chart below shows the average dividend income received monthly and the average amount of dividends received monthly. This chart helps me to understand my monthly dividends and total yearly projected dividends. I am slowly investing in dividend paying stocks and if I continue to do like this income will continue to grow.

The chart and the table below summarizes my dividend distribution in the portfolio. The most percentages of dividends I am receiving are from the Vanguard High Yield (VYM), AbbVie (ABBV), At&t (T), and Kimberly Clark (KMB). They are 35% of my total dividends that I receive yearly.

Dividend sources in the table format:

The following tree-map shows the percentages of dividends that I am receiving from the individual stocks and also compares between the sectors. it help me to understand which sectors are paying me the most in dividends. The map shows that I am getting the highest amount of dividends from the health sectors followed by consumer defensive, ETFs, and consumer cyclical.

The following table shows the dividends that I received from my positions in each month. This chart is very helpful to track my monthly income through dividends.

The next table shows the total amount of dividends received so far in 2021. In February, I have received $104 which is the highest so far in this part of the quarter.

The next table shows my dividend growth performance in the year 2021. last year, none of my holdings cut their dividends.

No comments:
Post a Comment