Friday, June 21, 2024

Stock Market Summary - 6/21/2024


Today's top 10 gainers on my watchlist:

                                        Ticker % Gain

DoorDash Inc                         $DASH 3.33

Gilead Sciences, Inc.         $GILD 3.18

Manhattan Associates Inc $MANH 3.02

Palo Alto Networks Inc         $PANW 2.99

Intuit Inc                                 $INTU 2.61

Robinhood Markets Inc         $HOOD 2.58

Danaher Corp                         $DHR 2.53

Bunge Global SA                 $BG 2.45

NXP Semiconductors NV $NXPI 2.4

                                        $EW 2.34


                    Today's worst 10 performers on my watchlist:

                                                        Ticker % Loss

Cipher Mining Inc                         $CIFR -12.98

CleanSpark Inc                         $CLSK -9.81

Riot Platforms Inc                         $RIOT -8.35

Marathon Digital Holdings Inc $MARA -7.02

Bitfarms Ltd                                 $BITF -5.77

Broadcom Inc                                 $AVGO -4.38

Coinbase Global Inc                 $COIN -3.9

NVIDIA Corp                                 $NVDA -3.22

Micron Technology Inc                 $MU -3.22

WestRock Co                                 $WRK -2.85


Notable stocks that reached 52 week high today:

Alphabet Inc Class A                     $GOOGL

Walmart Inc                                     $WMT

Honeywell International Inc             $HON

AT&T Inc                                     $T

Regeneron Pharmaceuticals Inc     $REGN

Boston Scientific Corporation     $BSX

Marsh & McLennan Companies Inc  $MMC

Colgate-Palmolive Company             $CL

McKesson Corp                             $MCK

Ecolab Inc                                     $ECL

Motorola Solutions Inc                     $MSI

Roper Technologies Inc                     $ROP

Aflac Inc                                             $AFL

Ameriprise Financial, Inc.             $AMP

Sea Ltd                                             $SE

Verisk Analytics, Inc.                     $VRSK

Corning Inc                                     $GLW

Targa Resources Corp                     $TRGP

Brown & Brown, Inc.                     $BRO

ADT Inc                                             $ADT

Stocks that reached 52 week low today:

Baidu Inc                         $BIDU

Li Auto Inc                         $LI

Albertsons Companies Inc $ACI

Albemarle Corporation         $ALB

Solventum Corp                 $SOLV

SoFi Technologies Inc         $SOFI

Unity Software Inc                 $U

Hugo Boss AG - ADR         $BOSSY

Solaredge Technologies Inc $SEDG

Udemy Inc                         $UDMY

Figs Inc                                 $FIGS

Lionsgate Studios Corp         $LION

Today's highest option volume:

NVIDIA Corp                                                 $NVDA 10.62M

Advanced Micro Devices, Inc.                 $AMD 2.07M

Apple Inc                                                 $AAPL 1.71M

Tesla Inc                                                         $TSLA 1.59M

Amazon.com Inc                                         $AMZN 733.27K

GameStop Corp                                         $GME 614.80K

Palantir Technologies Inc                         $PLTR 612.21K

Dell Technologies Inc                                 $DELL 469.10K

Super Micro Computer Inc                         $SMCI 454.89K

Micron Technology Inc                                 $MU 392.62K

Marathon Digital Holdings Inc                 $MARA 343.32K

Intel Corp                                                 $INTC 308.56K

Taiwan Semiconductor Mfg. Co. Ltd.         $TSM 299.18K

Arm Holdings PLC - ADR                         $ARM 273.99K

Meta Platforms Inc                                         $META 261.30K

Microsoft Corp                                         $MSFT 237.40K

ChargePoint Holdings Inc                         $CHPT 197.24K

Sirius XM Holdings Inc                                 $SIRI 194.83K

Trump Media & Technology Group Corp $DJT 182.66K

Bank of America Corp                                 $BAC 177.47K

AMC Entertainment Holdings Inc                 $AMC 166.10K

Broadcom Inc                                                 $AVGO 158.66K

Salesforce Inc                                                 $CRM 157.11K

Alphabet Inc Class A                                 $GOOGL151.02K

SoFi Technologies Inc                                 $SOFI 150.51K

Coinbase Global Inc                                 $COIN 150.06K

Alibaba Group Holding Ltd - ADR         $BABA 145.37K

Qualcomm Inc                                         $QCOM 140.63K

Gilead Sciences, Inc.                                 $GILD 135.93K

PayPal Holdings Inc                                 $PYPL 134.38K

Pfizer Inc                                                 $PFE 133.50K

Robinhood Markets Inc                                 $HOOD 131.70K

Riot Platforms Inc                                         $RIOT 127.65K

Rivian Automotive Inc                                 $RIVN 126.22K

Snowflake Inc                                                 $SNOW 122.53K

Exxon Mobil Corp                                         $XOM 120.72K

Boeing Co                                                 $BA 117.26K

Cisco Systems Inc                                         $CSCO 116.73K

Tuesday, June 18, 2024

Stock Market Summary - Daily gains and losses

 Today's top 10 gainers on my watchlist:

Celsius Holdings, Inc.         $CELH +8.32%

Williams-Sonoma, Inc.         $WSM +4.82%

Vistra Corp                         $VST +4.52%

Constellation Energy Corp $CEG +3.96%

Cheniere Energy Inc         $LNG +3.95%

Micron Technology Inc         $MU +3.8%

Super Micro Computer Inc $SMCI +3.67%

NVIDIA Corp                         $NVDA +3.51%

DraftKings Inc                 $DKNG +3.10%

Trane Technologies PLC $TT         +2.97%


                     Today's worst 10 stocks on my watchlist:

Ball Corp                             $BALL -6.28%

Lennar Corp                             $LEN         -4.95%

Coinbase Global Inc             $COIN -3.73%

Estee Lauder Companies Inc     $EL         -3.56%

iShares Bitcoin Trust             $IBIT         -3.53%

Shopify Inc                             $SHOP -3.44%

Autoliv Inc                             $ALV         -2.93%

Charter Communications Inc     $CHTR -2.91%

PDD Holdings Inc - ADR     $PDD         -2.78%

PulteGroup, Inc.                     $PHM         -2.69%


Monday, June 17, 2024

Stock market summary - 6/17/2024


Today's worst 10 performers on my watchlist:

Vistra Corp                         $VST -4.05%
Crown Castle Inc                 $CCI -2.79%
Albemarle Corporation         $ALB -2.78%
PG&E Corp                         $PCG -2.58%
Celsius Holdings, Inc.         $CELH -2.57%
SBA Communications Corp $SBAC -2.43%
American Tower Corp         $AMT -2.41%
Eversource Energy                 $ES         -2.3%
Edison International         $EIX -2.29%
Hershey Co                         $HSY -2.12%


Today's top 10 performers on my watchlist:

Jabil Inc                                 $JBL 4.14%
Micron Technology Inc         $MU 4.58%
General Electric Co                 $GE         4.72%
Steel Dynamics Inc                 $STLD 4.86%
Super Micro Computer Inc $SMCI 5.08%
Tesla Inc                                 $TSLA 5.30%
Broadcom Inc                         $AVGO 5.41%
DraftKings Inc                         $DKNG 7.81%
CleanSpark Inc                 $CLSK 8.64%
Bitfarms Ltd                         $BITF 9.41%


Notable stocks that reached 52 week high today:

Microsoft Corp                                         $MSFT
NVIDIA Corp                                         $NVDA
Taiwan Semiconductor Mfg. Co. Ltd. $TSM
Broadcom Inc                                         $AVGO
Eli Lilly And Co                                 $LLY
Costco Wholesale Corporation         $COST
Netflix Inc                                         $NFLX
Qualcomm Inc                                         $QCOM
Applied Materials, Inc.                         $AMAT
Micron Technology Inc                         $MU
Intuitive Surgical, Inc.                         $ISRG
Unilever plc                                         $UL
Lam Research Corporation                 $LRCX
Honeywell International Inc                 $HON
Booking Holdings Inc                         $BKNG
TJX Companies Inc                                 $TJX
Marsh & McLennan Companies Inc $MMC
SoftBank Group Corp - ADR                 $SFTBY
Crowdstrike Holdings Inc                 $CRWD
Chipotle Mexican Grill, Inc.                 $CMG
Colgate-Palmolive Company                 $CL
McKesson Corp                                 $MCK
Cintas Corp                                         $CTAS
Motorola Solutions Inc                         $MSI
Trade Desk Inc                                 $TTD
Kimberly-Clark Corp                         $KMB
Sea Ltd                                                 $SE
Corning Inc                                         $GLW
Tractor Supply Co                                 $TSCO
Pinterest Inc                                         $PINS
Hewlett Packard Enterprise Co         $HPE
Church & Dwight Co., Inc.                 $CHD
Best Buy Co Inc                                 $BBY
Essex Property Trust Inc                         $ESS
DICK'S Sporting Goods Inc                 $DKS
BJ's Wholesale Club Holdings Inc         $BJ
Crocs Inc                                                 $CROX
Hims & Hers Health Inc                         $HIMS

        Notable stocks that reached 52 week low today:

Cisco Systems Inc                                 $CSCO
National Grid plc                                 $NGG
Baidu Inc                                                 $BIDU
Li Auto Inc                                         $LI
Zoom Video Communications Inc         $ZM
Warner Bros Discovery Inc                 $WBD
Nissan Motor Co Ltd                         $NSANY
Albemarle Corporation                         $ALB
Mosaic Co                                         $MOS
Exact Sciences Corp                         $EXAS
Paramount Global Class B                 $PARA
UiPath Inc                                         $PATH
Unity Software Inc                                 $U
BILL Holdings Inc                                 $BILL
Virgin Galactic                                         $SPCE
MSC Industrial Direct Co Inc                 $MSM
Solaredge Technologies Inc                 $SEDG

Sunday, June 16, 2024

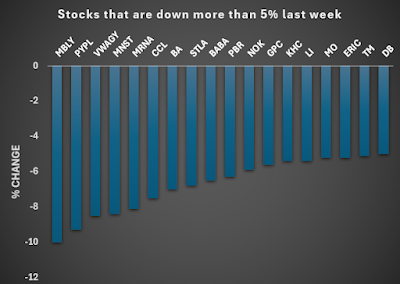
Stocks were up and down more than 5% last week


Stocks that were down more than 5% last week:

Ticker                        % Change

MBLY     Mobileye              -10

PYPL     Paypal                      -9.3

VWAGY     Volkswagen              -8.5

MNST     Monster              -8.4

MRNA     Moderna              -8.1

CCL    Carnival              -7.5

BA            Boeing                      -7

STLA    Stelantis              -6.8

BABA    AliBaba              -6.5

PBR    Petrobras              -6.3

NOK    Nokia                      -5.9

GPC    Genuiene parts      -5.6

KHC    Kraft & Heinz      -5.4

LI            Li Auto                      -5.4

MO            Altira                      -5.2

ERIC   Ericsson              -5.2

TM           Toyota                      -5.1

DB           Deutsche Bank      -5


Stocks that were down more than 5% last week:

Ticker                                  % Gain
AVGO         Broadcom                24
ARM         Arm Holdings                17
SWKS         SkyWorks                16
ADBE         Adobe                        16
Z                 Zillow                        14
QRVO         Qorvo                        14
ELF                 Elf Beauty                11
SMCI         Super Micro Computer  11
SHOP         Shopify                        10
ORCL         Oracle                        9.8
MRVL         Marvel                        9.4
NVDA         Nvidia                        9.1
MU                 Micron                        9
LRCX         Lam Research                8.6
HPE         Hewlett & Packard        8.5
STX         Seagate                        8.4
AMAT         Applied Materials        8.3
CEG         Constellation Energy     8
AAPL         Apple                        7.9
DDOG         Datadog                        7.7
LII                 Lennox International     7.5
CDNS         Cadence Design        6.5
HD                 Home Depot                6.2
TSM         Taiwan Semiconductor  5.2


Saturday, June 15, 2024

I recently bought this dividend growth stock

The outlook for PPG Industries (PPG) stock in 2024 appears to be cautiously optimistic based on recent analyst assessments. The consensus among analysts is generally positive, with an average price target around $155 to $155.83, representing an approximate 19% upside from its current price of $130. This consensus includes both strong buy and hold ratings, indicating a varied but overall positive sentiment.

Key considerations include:

  1. Revenue and Earnings Growth: PPG's revenue is projected to grow modestly over the next few years, with estimates of $18.68 billion in 2024 and $19.32 billion in 2025. Earnings per share (EPS) are also expected to see significant growth, from $8.53 in 2024 to $9.43 in 2025.
  2. Industry Comparison: While PPG's revenue growth forecast of 2.39% is slightly below the specialty chemicals industry average of 3.28%, it remains a strong player within its sector.
  3. Analyst Ratings: The stock has received a mix of strong buy, buy, and hold ratings from different analysts. For instance, Deutsche Bank and Wells Fargo maintain strong buy ratings with price targets of $155 and $163, respectively, while other firms like UBS and Citigroup have more cautious hold recommendations.
Revenue of $PPG since 2003:
Revenue of $PPG since 2003.


The chart above illustrates the revenue of PPG Industries from 2003 to 2023. Key observations include:
  • Steady Growth with Fluctuations: There is an overall trend of revenue growth over the two decades, with significant increases in certain years.
  • Significant Peaks and Drops: The most notable peak is in 2008, followed by a drop in 2009, likely reflecting the global financial crisis. Revenue again peaks around 2021 and continues to rise through 2023.
  • Recent Growth: There is a notable increase in revenue starting from 2020, with significant jumps in 2021 and 2022, and continued growth into 2023.

This analysis highlights PPG Industries' resilience and ability to recover and grow even through economic downturns.

Revenue growth of $PPG since 2004:

Revenue growth of PPG since 2004

The chart illustrates the revenue growth of PPG Industries from 2004 to 2023. Here are some key observations:

  • Significant Fluctuations: PPG's revenue growth has seen considerable fluctuations over the years, with notable highs and lows.
  • Major Peak in 2008: The most significant growth occurred in 2008 with a 41.43% increase, followed by a sharp decline in 2009 with a -22.78% decrease, likely reflecting the impact of the global financial crisis.
  • Recent Trends: The years 2021 and 2022 showed strong recovery and growth at 21.45% and 5.06%, respectively, likely driven by post-pandemic economic recovery.
  • Consistent Performance: Despite some years of negative growth, PPG has generally maintained a positive growth trend, with the latest data showing a 3.37% increase in 2023.

This analysis highlights PPG Industries' resilience and ability to navigate through economic challenges, maintaining overall growth over the long term.

PPG dividend payout since 2003:

Analysis of PPG's Dividend Payments (2003-2023):

Dividend payout of PPG since 2003
  1. Consistent Growth: PPG Industries has consistently increased its dividend payments from $0.8650 in 2003 to $2.5400 in 2023. This indicates a strong commitment to returning value to shareholders. 

  2. Steady Increases: The dividend has generally increased every year, with noticeable increments in recent years. For example, from 2018 to 2023, the dividend increased from $1.8600 to $2.5400. Its 5-year dividend CAGR is 6.43%.

  3. Significant Milestones:

    • 2008: Despite the financial crisis, PPG managed to increase its dividend.
    • 2014-2016: There was a notable increase in the dividend amount during these years, reflecting strong financial performance.
  4. Recent Performance: The increases in 2021, 2022, and 2023 highlight the company's ability to maintain strong financial health and shareholder returns even in challenging economic conditions.

Dividend Growth % since 2004:

Dividend Growth % since 2004

PPG's consistent dividend growth is a positive indicator for investors looking for a steady income and signals the company's robust financial health and commitment to its shareholders.

  1. Consistent Growth: PPG Industries has consistently increased its dividends since 2004. The annual growth rates reflect a steady commitment to increasing shareholder value through dividends.

  2. Early Years (2004-2010): The growth rates in this period were relatively modest, ranging from about 1.91% to 6.81%. This reflects a cautious approach in the years following the early 2000s recession and leading up to the global financial crisis in 2008.

  3. Post-Financial Crisis (2011-2015): During these years, PPG showed a more robust dividend growth strategy. Notably, in 2014 and 2015, the growth rates were 8.26% and 8.02%, respectively, indicating strong financial health and confidence in the company’s future.

  4. High Growth Period (2016-2018): This period saw significant increases in dividend payments, with 2016 marking the highest growth rate at 10.25%. This was followed by 8.97% in 2017 and 9.41% in 2018, reflecting strong earnings and cash flow generation.

  5. Recent Years (2019-2023): Dividend growth rates in recent years have remained solid, albeit at a slightly lower pace compared to the mid-2010s. The growth rates ranged from 4.96% in 2023 to 7.62% in 2021. This consistent growth, even during the COVID-19 pandemic in 2020, shows the company’s resilience and commitment to rewarding shareholders.

Key Takeaways:

  • Steady and Reliable: PPG has demonstrated a steady and reliable approach to increasing its dividends over the past two decades. This consistency is a positive sign for income-focused investors.
  • Response to Economic Conditions: The company’s dividend growth strategy reflects its ability to adapt to varying economic conditions. Even during economic downturns, PPG managed to increase dividends, though at a more conservative rate.
  • Strong Recent Performance: The high growth rates in the mid-2010s and the steady increases in recent years indicate strong financial health and a solid earnings base, supporting sustainable dividend payments.
PPG income since 2003:
PPG Net Income since 2003
  1. Overall Growth: PPG Industries has shown significant growth in net income from 2003 to 2023, despite some fluctuations along the way. The net income has increased from $494 million in 2003 to $1.27 billion in 2023.

  2. Early Growth and Mid-2000s Performance:

    • 2003-2007: PPG's net income showed consistent growth during this period, reaching $834 million in 2007 from $494 million in 2003. This steady increase indicates a period of strong performance and expansion.
    • 2008: There was a noticeable drop in net income to $538 million, reflecting the impact of the global financial crisis.
  3. Post-Crisis Recovery:

    • 2009-2011: After the dip in 2008, PPG's net income recovered to $769 million in 2010 and then jumped to $1.095 billion in 2011, indicating a strong recovery phase.
    • 2012-2014: The net income remained robust, with a significant peak in 2013 at $3.231 billion, which was unusually high. This spike might be due to one-time gains or extraordinary items. The net income normalized to $2.102 billion in 2014.
  4. Recent Performance:

    • 2015-2020: The net income fluctuated during these years, with a low of $873 million in 2016 and a high of $1.594 billion in 2017. The income dipped to $1.059 billion in 2020, reflecting the economic impact of the COVID-19 pandemic.
    • 2021-2023: Post-pandemic, PPG's net income increased to $1.439 billion in 2021, then decreased slightly to $1.026 billion in 2022, before rising again to $1.27 billion in 2023.

Key Observations:

  • Economic Sensitivity: PPG's net income reflects sensitivity to broader economic conditions, with notable dips during the 2008 financial crisis and the 2020 pandemic.
  • Strong Recovery and Growth: The periods of recovery post-crisis show PPG's ability to rebound and achieve significant net income growth.
  • Exceptional 2013: The net income in 2013 stands out as an exceptional year, possibly due to one-time events that need further investigation to understand the underlying causes.

PPG's net income growth:

PPG net income growth
  1. Volatility in Growth Rates:

    • PPG Industries' net income growth rates have exhibited significant volatility over the past two decades. This reflects the company's sensitivity to both internal factors and external economic conditions.
  2. Early Growth and Decline (2004-2009):

    • 2004-2007: The company experienced strong growth, with net income growth rates of 38.26% in 2004, 19.30% in 2006, and 17.30% in 2007. This indicates robust performance and operational efficiency during these years.
    • 2008-2009: The global financial crisis had a profound impact on PPG, with net income declining by 35.49% in 2008 and a further 37.55% in 2009.
  3. Recovery and Exceptional Growth (2010-2014):

    • 2010-2011: PPG saw a remarkable recovery, with net income growth of 128.87% in 2010 and 42.39% in 2011, highlighting the company's resilience and ability to rebound strongly from the financial crisis.
    • 2013: An extraordinary spike of 243.36% in net income growth was observed, likely due to one-time gains or significant operational improvements.
    • 2014: This exceptional year was followed by a decline of 34.94% in 2014, indicating a return to more normalized levels.
  4. Mid-2010s Decline and Rebound (2015-2020):

    • 2015-2016: The company faced challenges, with net income growth declining by 33.11% in 2015 and 37.91% in 2016. This period likely reflects operational difficulties or market challenges.
    • 2017: A significant rebound occurred in 2017, with net income growth of 82.59%.
    • 2018-2020: Growth rates were negative again in these years, with the pandemic in 2020 leading to a 14.80% decline in net income.
  5. Recent Performance (2021-2023):

    • 2021: PPG showed strong recovery with a net income growth of 35.88%, reflecting the post-pandemic economic recovery.
    • 2022: Another challenging year with a decline of 28.70%.
    • 2023: A positive growth of 23.78%, indicating improved financial performance.

Key Observations:

  • Economic Sensitivity: The volatility in net income growth rates highlights PPG's sensitivity to broader economic conditions, including the global financial crisis and the COVID-19 pandemic.
  • Strong Recovery Capabilities: Despite significant downturns, PPG has demonstrated the ability to recover robustly, as seen in the strong growth years following economic downturns.
  • Exceptional Gains and Corrections: The extraordinary spike in 2013 and subsequent corrections indicate periods of exceptional gains, possibly due to strategic initiatives or market conditions, followed by normalization.

PPG's Free Cash Flow per share since 2003:
PPG free cash flow per share

  1. Early Years (2003-2007):

    • 2003-2004: PPG's free cash flow per share (FCF per share) started at $2.67 in 2003 and dropped to $2.26 in 2004, showing an initial decline.
    • 2005-2007: FCF per share remained relatively stable around $2.29 in 2005 and 2006, before dropping to $1.95 in 2007. This period reflects a phase of stability followed by a decrease, likely due to increased capital expenditures or operational challenges.
  2. Financial Crisis and Recovery (2008-2011):

    • 2008: FCF per share increased significantly to $2.96 during the financial crisis, suggesting strong cash management and possibly reduced capital spending.
    • 2009-2011: The trend continued upward with $3.36 in 2009, $3.05 in 2010, and $3.32 in 2011. This indicates robust cash generation and effective cost controls during a challenging economic period.
  3. Post-Crisis Performance (2012-2015):

    • 2012-2013: FCF per share peaked at $4.49 in 2012, followed by a slight decrease to $4.45 in 2013. This period reflects strong cash flow generation.
    • 2014-2015: There was a drop to $3.40 in 2014 but a substantial increase to $5.01 in 2015, indicating a recovery and strong financial performance.
  4. Recent Trends (2016-2023):

    • 2016-2017: FCF per share saw fluctuations with $3.48 in 2016 and an increase to $4.72 in 2017, showing variability in cash flow generation.
    • 2018-2020: A stable to increasing trend with $4.33 in 2018, a significant rise to $7.04 in 2019, and further to $7.71 in 2020, reflecting strong cash flow during the pandemic period, possibly due to reduced capital expenditures and strong operational performance.
    • 2021: A notable decline to $5.01, indicating potential increased capital spending or operational challenges.
    • 2022: A sharp drop to $1.88, suggesting significant operational or financial adjustments, possibly due to increased costs or investments.
    • 2023: A strong recovery to $7.89, indicating robust cash flow generation and effective financial management.

Key Observations:

  • Volatility: PPG's FCF per share has been quite volatile, reflecting changes in operational efficiency, capital expenditures, and economic conditions.
  • Strong Recovery Post-Crisis: The periods following economic downturns, such as post-2008 and post-2020, show strong recoveries in FCF per share, indicating the company's resilience and effective cash management.
  • Exceptional Years: Notable peaks in 2012, 2019, 2020, and 2023 highlight periods of exceptional cash flow generation, possibly due to strategic initiatives or favorable market conditions.
  • Challenges: Significant drops in certain years, particularly in 2014, 2016, and 2022, suggest periods of increased capital spending or operational challenges.
PPG's Shares Outstanding:
Shares outstanding
  1. Overall Trend:

    • Over the 20-year period from 2003 to 2023, PPG Industries' shares outstanding have generally decreased from 339,518,900 shares in 2003 to 236,000,000 shares in 2023.
  2. Initial Increase and Stabilization (2003-2009):

    • 2003-2005: The number of shares increased slightly from 339,518,900 in 2003 to 343,216,080 in 2004 and then decreased back to 339,601,140 in 2005, reflecting minor fluctuations in shares outstanding.
    • 2006-2009: Shares outstanding decreased gradually from 331,468,531 in 2006 to 329,600,000 in 2009, indicating a trend towards stabilization.
  3. Significant Reductions (2010-2020):

    • 2010-2011: There was a noticeable reduction from 329,000,000 in 2010 to 314,600,000 in 2011, showing a significant buyback or reduction in shares.
    • 2012-2014: The reduction continued, with shares outstanding dropping from 306,800,000 in 2012 to 276,600,000 in 2014. This period indicates aggressive share repurchase programs.
    • 2015-2017: Further reductions brought the number of shares down from 271,400,000 in 2015 to 256,100,000 in 2017.
    • 2018-2020: Continued decline to 236,800,000 shares by 2020, suggesting ongoing buyback efforts to return value to shareholders.
  4. Stabilization in Recent Years (2021-2023):

    • 2021-2023: The number of shares outstanding stabilized around 236,000,000 to 237,600,000, indicating a plateau in share repurchase activities or a strategic decision to maintain the current level of shares outstanding.

Key Observations:

  • Share Repurchase Strategy: PPG Industries has clearly employed a consistent share repurchase strategy over the past two decades. This strategy reduces the number of outstanding shares, which can enhance earnings per share (EPS) and return value to shareholders.
  • Impact of Buybacks: Significant reductions in shares outstanding, particularly from 2011 to 2020, reflect aggressive buyback programs. This likely contributed to higher EPS and potentially increased stock prices during this period.
  • Recent Stabilization: The stabilization of shares outstanding in recent years suggests that PPG may have reached a target level for its share repurchase program or is conserving cash for other strategic uses.
Summary:
  1. Revenue and Earnings Growth:

    • 5-Year Revenue CAGR: 3.48%. This indicates modest growth in revenue over the past five years. While the revenue growth is positive, it is relatively slow.
    • 5-Year EPS CAGR: -0.44%. This negative growth in earnings per share (EPS) suggests that the company's profitability per share has slightly declined over the last five years, despite revenue growth. This could be due to increased costs, higher share count, or other factors impacting net income.
  2. Free Cash Flow and Dividends:

    • 5-Year Free Cash Flow (FCF) CAGR: 12.75%. This strong growth in free cash flow indicates efficient cash management and robust cash generation capabilities.
    • 5-Year Dividend CAGR: 6.43%. The consistent and healthy growth in dividends highlights PPG’s commitment to returning value to shareholders.
  3. Valuation Metrics:

    • Current P/E Ratio: 15.03. This price-to-earnings ratio suggests that PPG is reasonably valued relative to its earnings. A P/E of 15.03 is generally seen as moderate, indicating that the market has a neutral to slightly positive outlook on the company's future earnings potential.
    • Dividend Payout Ratio: 30.34%. A payout ratio around 30% is considered healthy and sustainable, allowing PPG to retain a significant portion of earnings for reinvestment.
    • FCF Payout Ratio: 32.57%. Similar to the dividend payout ratio, this indicates that PPG is returning a manageable portion of its free cash flow to shareholders while retaining enough to support future growth.
  4. Free Cash Flow Metrics:

    • FCF Yield: 6.20%. This indicates a strong return on free cash flow relative to the stock price, suggesting that the company is generating good cash flow relative to its market valuation.
    • FCF Margin: 10.21%. This healthy margin indicates that a good portion of revenue is converted into free cash flow, reflecting efficient operations and cash generation capabilities.
  5. Financial Health:

    • Debt-to-Equity Ratio: 0.8. This moderate level of leverage indicates that PPG has a balanced capital structure, using debt prudently without over-leveraging.
  6. Analysts’ Price Target:

    • Average Price Target: $145 per share. Given the current valuation metrics and financial health, the average analyst price target suggests potential upside from the current price, indicating positive market sentiment and expected future growth.

Overall Assessment:

  • Strengths:

    • Strong Free Cash Flow: The high growth rate in free cash flow and solid FCF yield indicate strong cash generation, which is crucial for sustaining operations, paying dividends, and funding growth.
    • Dividend Growth: Consistent dividend growth reflects a commitment to returning value to shareholders and suggests confidence in future earnings stability.
    • Healthy Payout Ratios: Both dividend and FCF payout ratios are at sustainable levels, ensuring that the company can continue paying dividends without compromising financial stability.
  • Challenges:

    • Stagnant EPS Growth: The slight decline in EPS over the past five years is a concern, indicating that despite revenue and cash flow growth, profitability on a per-share basis has been under pressure.
    • Modest Revenue Growth: While revenue growth is positive, it is relatively slow, which may limit the potential for substantial earnings growth unless the company can improve operational efficiencies or find new growth drivers.
  • Valuation: The current P/E ratio of 15.03 suggests that the stock is fairly valued. Given the solid free cash flow metrics and healthy dividend payout, the stock could be attractive to investors seeking stable income and moderate growth potential.

Monday, June 10, 2024

Apple WWDC 2024: Unveiling the Future of AI and Cross-Platform Innovation

 At Apple's WWDC 2024, several significant software updates were announced, focusing heavily on AI enhancements and new features across multiple platforms.


iOS 18

iOS 18 will bring substantial changes, including major updates to the home screen allowing users to place icons and widgets freely and customize app icon colors. The Messages app will gain RCS support, improving communication between iPhone and Android users. Other updates include AI-driven features like custom emoji creation, photo editing through commands, transcription for audio recordings, and smart summaries in Safari​ (9to5Mac)​​ (Engadget)​.


macOS 15

macOS 15 will also see many AI integrations, especially in built-in apps like Photos, Mail, and Notes. The system settings will be reorganized for better usability. Many features from iOS 18, such as updates to Apple Music and the Notes app, will also appear in macOS 15​ (MacRumors)​​ (AppleInsider)​.


iPadOS 18

iPadOS 18 will inherit many of the new features from iOS 18, including the long-awaited Calculator app. A notable addition is the eye-tracking feature for hands-free control, enhancing accessibility​ (AppleInsider)​​ (Engadget)​.


visionOS 2

VisionOS 2 will bring improvements to the Vision Pro headset, including new apps built natively for visionOS and features like Live Captions for real-time dialogue transcription​ (9to5Mac)​.


Other Updates

Updates to watchOS 11, tvOS 18, and HomePod Software 18 were also mentioned, but specific details are limited. Additionally, Apple introduced a new Passwords app to streamline password management across devices​ (MacRumors)​​ (9to5Mac)​.


Hardware Announcements

Unlike previous years, no new hardware was announced at WWDC 2024. The focus was entirely on software updates​ (AppleInsider)​​ (Engadget)​.


Overall, WWDC 2024 emphasized Apple's commitment to enhancing user experience through AI and improving cross-platform integration and functionality.

Apple Calculator:

At WWDC 2024, Apple announced significant updates to the Calculator app, which will be available on iPhone, iPad, and Mac. The revamped Calculator app will feature:

  1. Notes Integration: Users can integrate their calculations directly with the Notes app, making it easier to keep track of and annotate their calculations.
  2. Improved Unit Conversions: The app will have enhanced unit conversion capabilities, making it more versatile for different types of calculations.
  3. Sidebar for Recent Activity: A new sidebar will display recent activity, allowing users to quickly reference and reuse previous calculations.

This update will also bring the Calculator app to iPadOS for the first time, addressing a long-standing user request​ (9to5Mac)​​ (Engadget)​.