Showing posts with label AMAT. Show all posts

Monday, June 17, 2024

Stock market summary - 6/17/2024


Today's worst 10 performers on my watchlist:

Vistra Corp                         $VST -4.05%
Crown Castle Inc                 $CCI -2.79%
Albemarle Corporation         $ALB -2.78%
PG&E Corp                         $PCG -2.58%
Celsius Holdings, Inc.         $CELH -2.57%
SBA Communications Corp $SBAC -2.43%
American Tower Corp         $AMT -2.41%
Eversource Energy                 $ES         -2.3%
Edison International         $EIX -2.29%
Hershey Co                         $HSY -2.12%


Today's top 10 performers on my watchlist:

Jabil Inc                                 $JBL 4.14%
Micron Technology Inc         $MU 4.58%
General Electric Co                 $GE         4.72%
Steel Dynamics Inc                 $STLD 4.86%
Super Micro Computer Inc $SMCI 5.08%
Tesla Inc                                 $TSLA 5.30%
Broadcom Inc                         $AVGO 5.41%
DraftKings Inc                         $DKNG 7.81%
CleanSpark Inc                 $CLSK 8.64%
Bitfarms Ltd                         $BITF 9.41%


Notable stocks that reached 52 week high today:

Microsoft Corp                                         $MSFT
NVIDIA Corp                                         $NVDA
Taiwan Semiconductor Mfg. Co. Ltd. $TSM
Broadcom Inc                                         $AVGO
Eli Lilly And Co                                 $LLY
Costco Wholesale Corporation         $COST
Netflix Inc                                         $NFLX
Qualcomm Inc                                         $QCOM
Applied Materials, Inc.                         $AMAT
Micron Technology Inc                         $MU
Intuitive Surgical, Inc.                         $ISRG
Unilever plc                                         $UL
Lam Research Corporation                 $LRCX
Honeywell International Inc                 $HON
Booking Holdings Inc                         $BKNG
TJX Companies Inc                                 $TJX
Marsh & McLennan Companies Inc $MMC
SoftBank Group Corp - ADR                 $SFTBY
Crowdstrike Holdings Inc                 $CRWD
Chipotle Mexican Grill, Inc.                 $CMG
Colgate-Palmolive Company                 $CL
McKesson Corp                                 $MCK
Cintas Corp                                         $CTAS
Motorola Solutions Inc                         $MSI
Trade Desk Inc                                 $TTD
Kimberly-Clark Corp                         $KMB
Sea Ltd                                                 $SE
Corning Inc                                         $GLW
Tractor Supply Co                                 $TSCO
Pinterest Inc                                         $PINS
Hewlett Packard Enterprise Co         $HPE
Church & Dwight Co., Inc.                 $CHD
Best Buy Co Inc                                 $BBY
Essex Property Trust Inc                         $ESS
DICK'S Sporting Goods Inc                 $DKS
BJ's Wholesale Club Holdings Inc         $BJ
Crocs Inc                                                 $CROX
Hims & Hers Health Inc                         $HIMS

        Notable stocks that reached 52 week low today:

Cisco Systems Inc                                 $CSCO
National Grid plc                                 $NGG
Baidu Inc                                                 $BIDU
Li Auto Inc                                         $LI
Zoom Video Communications Inc         $ZM
Warner Bros Discovery Inc                 $WBD
Nissan Motor Co Ltd                         $NSANY
Albemarle Corporation                         $ALB
Mosaic Co                                         $MOS
Exact Sciences Corp                         $EXAS
Paramount Global Class B                 $PARA
UiPath Inc                                         $PATH
Unity Software Inc                                 $U
BILL Holdings Inc                                 $BILL
Virgin Galactic                                         $SPCE
MSC Industrial Direct Co Inc                 $MSM
Solaredge Technologies Inc                 $SEDG

Sunday, June 16, 2024

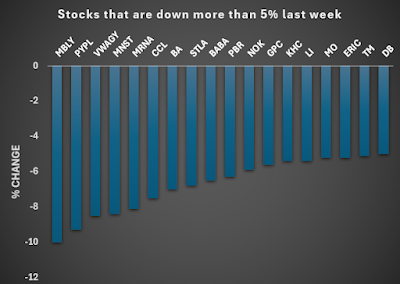
Stocks were up and down more than 5% last week


Stocks that were down more than 5% last week:

Ticker                        % Change

MBLY     Mobileye              -10

PYPL     Paypal                      -9.3

VWAGY     Volkswagen              -8.5

MNST     Monster              -8.4

MRNA     Moderna              -8.1

CCL    Carnival              -7.5

BA            Boeing                      -7

STLA    Stelantis              -6.8

BABA    AliBaba              -6.5

PBR    Petrobras              -6.3

NOK    Nokia                      -5.9

GPC    Genuiene parts      -5.6

KHC    Kraft & Heinz      -5.4

LI            Li Auto                      -5.4

MO            Altira                      -5.2

ERIC   Ericsson              -5.2

TM           Toyota                      -5.1

DB           Deutsche Bank      -5


Stocks that were down more than 5% last week:

Ticker                                  % Gain
AVGO         Broadcom                24
ARM         Arm Holdings                17
SWKS         SkyWorks                16
ADBE         Adobe                        16
Z                 Zillow                        14
QRVO         Qorvo                        14
ELF                 Elf Beauty                11
SMCI         Super Micro Computer  11
SHOP         Shopify                        10
ORCL         Oracle                        9.8
MRVL         Marvel                        9.4
NVDA         Nvidia                        9.1
MU                 Micron                        9
LRCX         Lam Research                8.6
HPE         Hewlett & Packard        8.5
STX         Seagate                        8.4
AMAT         Applied Materials        8.3
CEG         Constellation Energy     8
AAPL         Apple                        7.9
DDOG         Datadog                        7.7
LII                 Lennox International     7.5
CDNS         Cadence Design        6.5
HD                 Home Depot                6.2
TSM         Taiwan Semiconductor  5.2


Saturday, May 18, 2024

AMAT - Applied Materials a good stock to buy

 $AMAT- Applied Materials is looking like a good stock to buy.


Its current PE is 25.71. This is a good value for a tech stock.

The Price to Earnings (P/E) ratio is a financial metric used to evaluate the relative value of a company’s shares. It is calculated by dividing the market value per share by the earnings per share (EPS). Here’s the formula:

This ratio can give you an idea of what the market is willing to pay for a company’s earnings. A higher P/E ratio might indicate that the market expects future growth in earnings, while a lower P/E ratio could suggest that the stock is undervalued or that the company’s growth prospects are not as strong.

Dividend payout ratio: 19.39%.

The Dividend Payout Ratio is a financial metric that measures the percentage of a company’s net income that is distributed to shareholders in the form of dividends. It’s an indicator of how much money a company is returning to shareholders, versus how much it is retaining to reinvest in the business, pay off debt, or add to cash reserves.

The formula to calculate the Dividend Payout Ratio is:

Free cash flow payout ratio: 17.70%

The Free Cash Flow Payout Ratio is a financial metric that compares the dividends a company pays out to its shareholders to the free cash flow it generates. This ratio is particularly useful for investors who are interested in the sustainability of a company’s dividend payments. It can be calculated using the following formula:

A lower ratio suggests that a company is using a smaller portion of its free cash flow to pay dividends, which may indicate a more sustainable dividend policy. Conversely, a higher ratio could mean that a company is returning most of its free cash flow to shareholders, which might not be sustainable in the long term

Free Cashflow yield: 4.26%

Free cash flow margin: 28.63%

ROIC: 31.04%

ROE: 41.04%

Debt-to-equity: 0.34

$AMAT - Applied Materials has consistently demonstrated growth in revenue over the years. The revenue has been growing since 2013. Its 5-year revenue growth CAGR is 8.98%


$AMAT - Applied Materials, Inc. has demonstrated strong free cash flow performance over the years. Its 5-yr free cashflow CAGR is 23.68%


$AMAT - Applied Materials continues to reward its shareholders with steady dividend payments and growth. Its 5 year dividend CAGR is 11.75%.


$AMAT - Applied materials companies' outstanding share numbers keep dropping while the net income keeps going up which means the EPS will increase.


When a company’s outstanding shares decrease while net income increases, it has several implications:

  1. Earnings Per Share (EPS) Impact: EPS, which represents profit per share, tends to rise. Since net income is divided among fewer shares, each share “owns” a larger portion of the profit.

  2. Positive Signal: Investors often view this as a positive sign. It suggests that the company is efficiently managing its capital structure and returning value to shareholders through buybacks or other means