Portfolio Update - July 2020
Today I am going to show the status of my portfolio at the end of July 2020. Every month I am investing 10% of my salary. Out of that 10%, I invest 80% of it into dividend-paying stocks, 10% in non-dividend paying stocks, and 10% in Cryptos. I am not investing aggressively. This month I did not buy any stocks. I am saving cash. I am planning to buy my first house so maybe I will have to sell some of my holdings to pay for the downpayment. The following table shows my current portfolio distribution:

The following pie chart shows the same distribution and currently, Apple (AAPL) is my maximum holding followed by The Home Depot (HD), Abbvie (ABBV), and 3M (MMM). Recently, the price of AAPL, HD, and MSFT moved to an all-time high and because of this my position in these stocks increased and outpaced MMM and JNJ from the top 5 holdings.

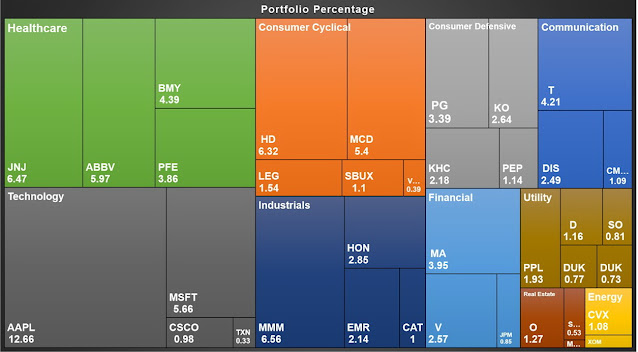
The sector distribution of my portfolio is shown in the following pie chart. The sectors are based on Yahoo Finance. Currently, my highest position is in the tech sector followed by healthcare and consumer cyclical. Recent surge in Apple and Microsoft stock pushed the tech sector to the top.

The following treemap shows the sector distributions and the stocks under each sector.

I keep track of my portfolio on the Tipranks website and the figure below compares my portfolio performance against the S&P 500. In most of the cases, my portfolio beat the market. This month my performance is lower than the S&P 500.

My performance as a portfolio manager is also impressive. At the end of July 2020, I was ranked 4112 out of 36,039 portfolio managers in the TipRanks which is at the top 11.4%. My portfolio has gained 65% since I started investing in 2017. My Sharpe ratio is 1.84 while the average ratio among the TipRanks investors is 0.66.

My 12-month returns (TTM) is 23.54% and YTD return is 9.31%. I am investing in stocks with a long term vision.

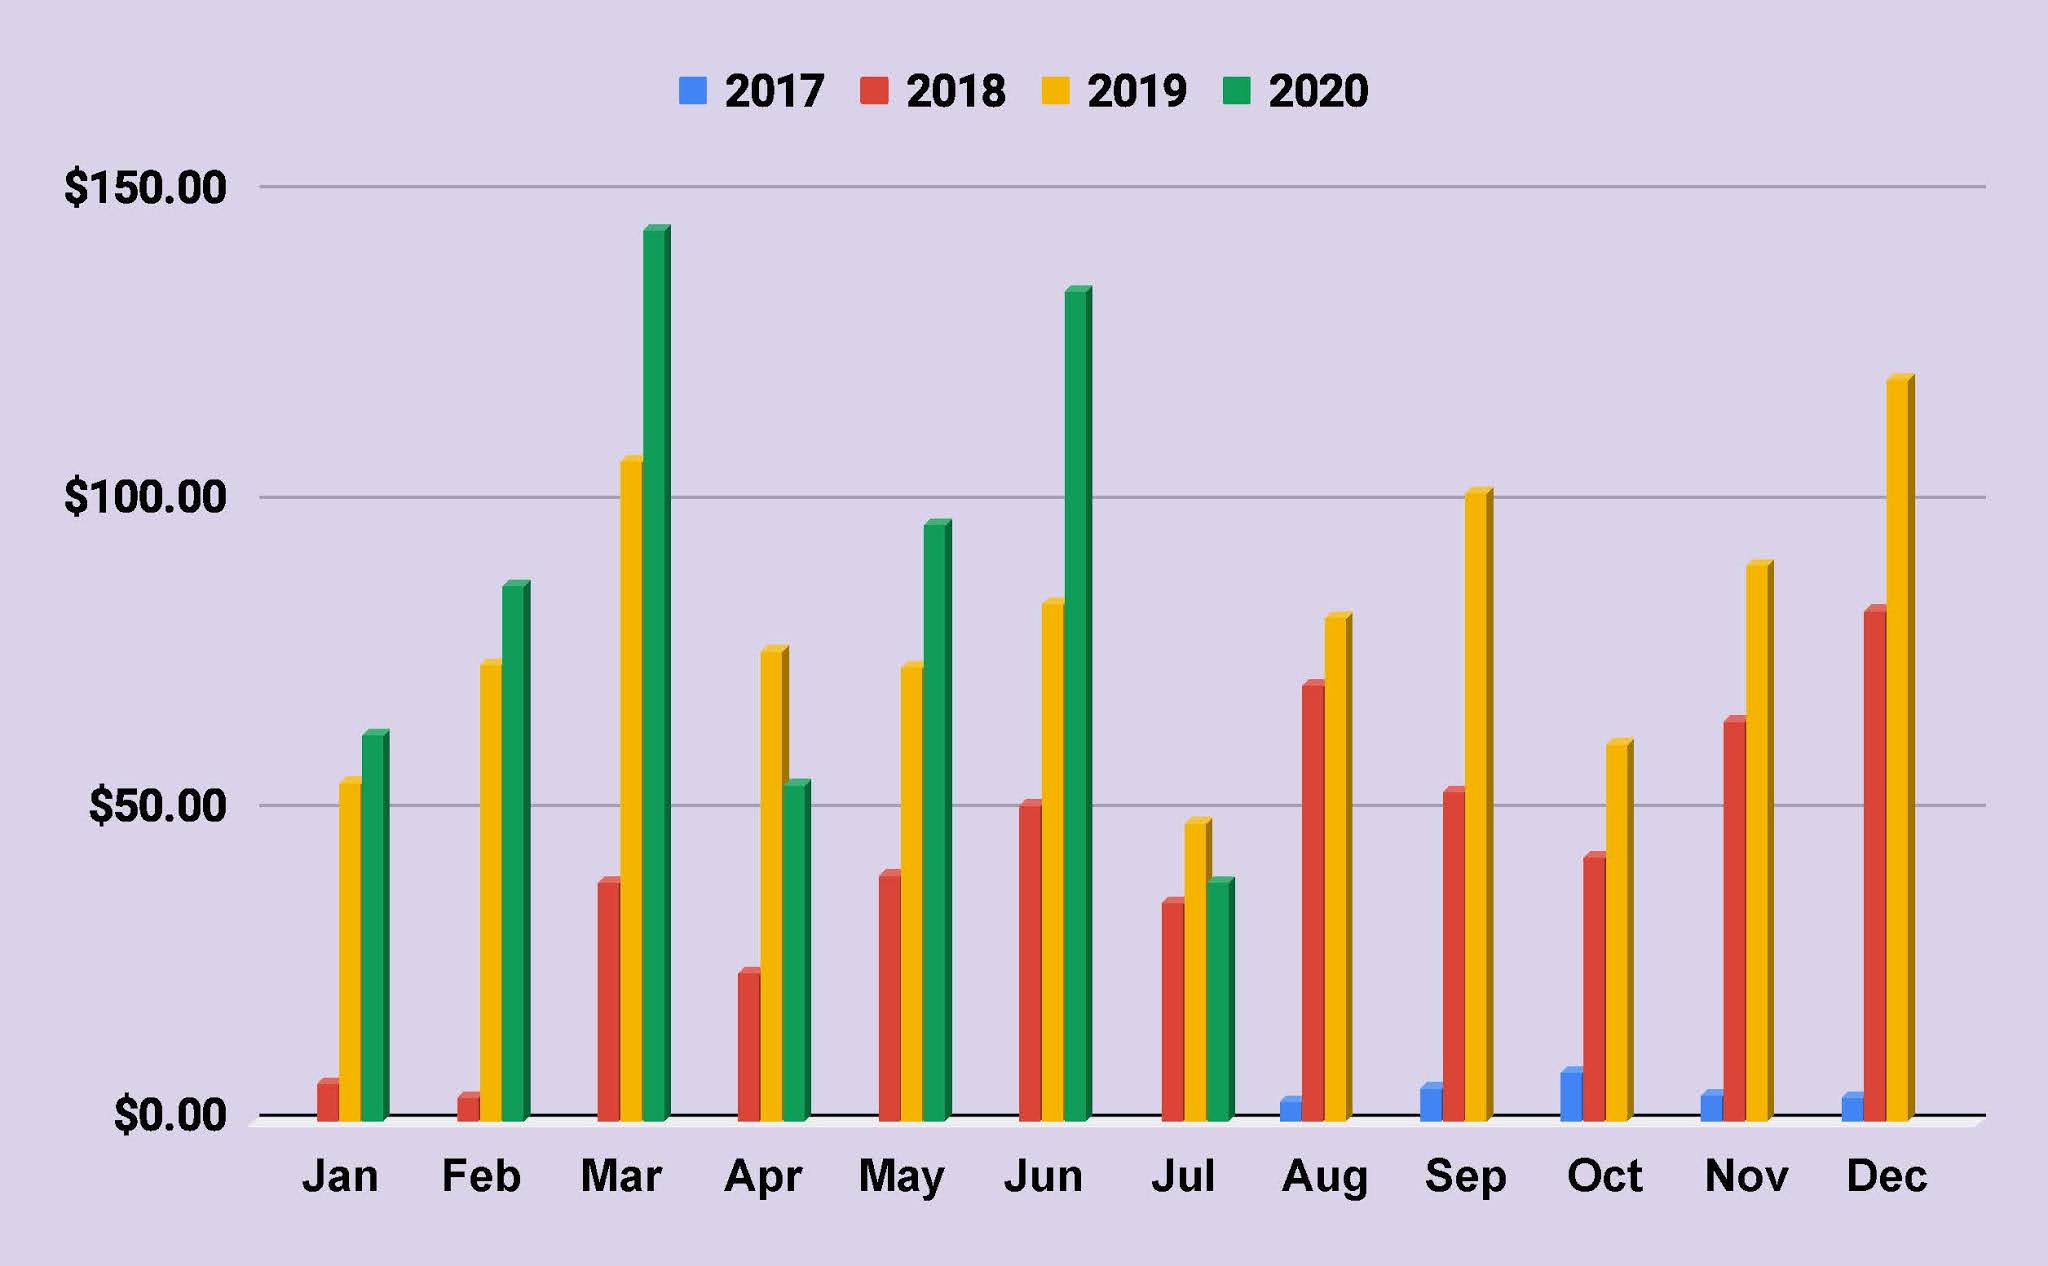
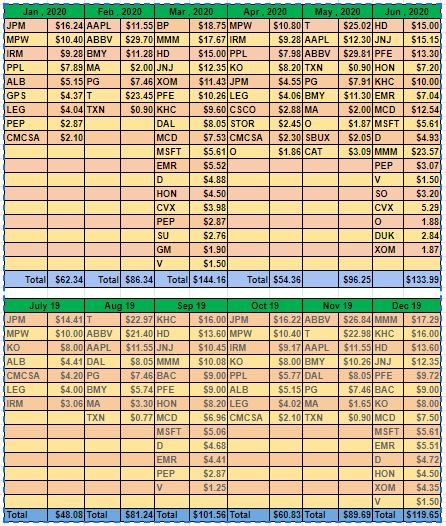
The table below shows the dividends that I received in July 2020. I have done DRIP of all the dividends that I received.

The following table shows the detailed performances of my portfolio. The current price in the table is based on the price on July 31st, 2020. In the chart, I have shared my current positions, annual income through dividends, total received dividends from each company so far, cost basis, YOC, current yield, and finally the total gain or loss including the dividend income. My top 5 performers based on gain so far are AAPL (156%), MSFT (147%), MA (109%), PG (84%), and V(74%). I am in loss with all of the energy stocks.

The following treemap shows my gains in every sector under each stock. I have a huge gain in the tech sector followed by financial, and consumer cyclical.